![]() Brandon Wendell, CMT
Brandon Wendell, CMT
Brandon Wendell
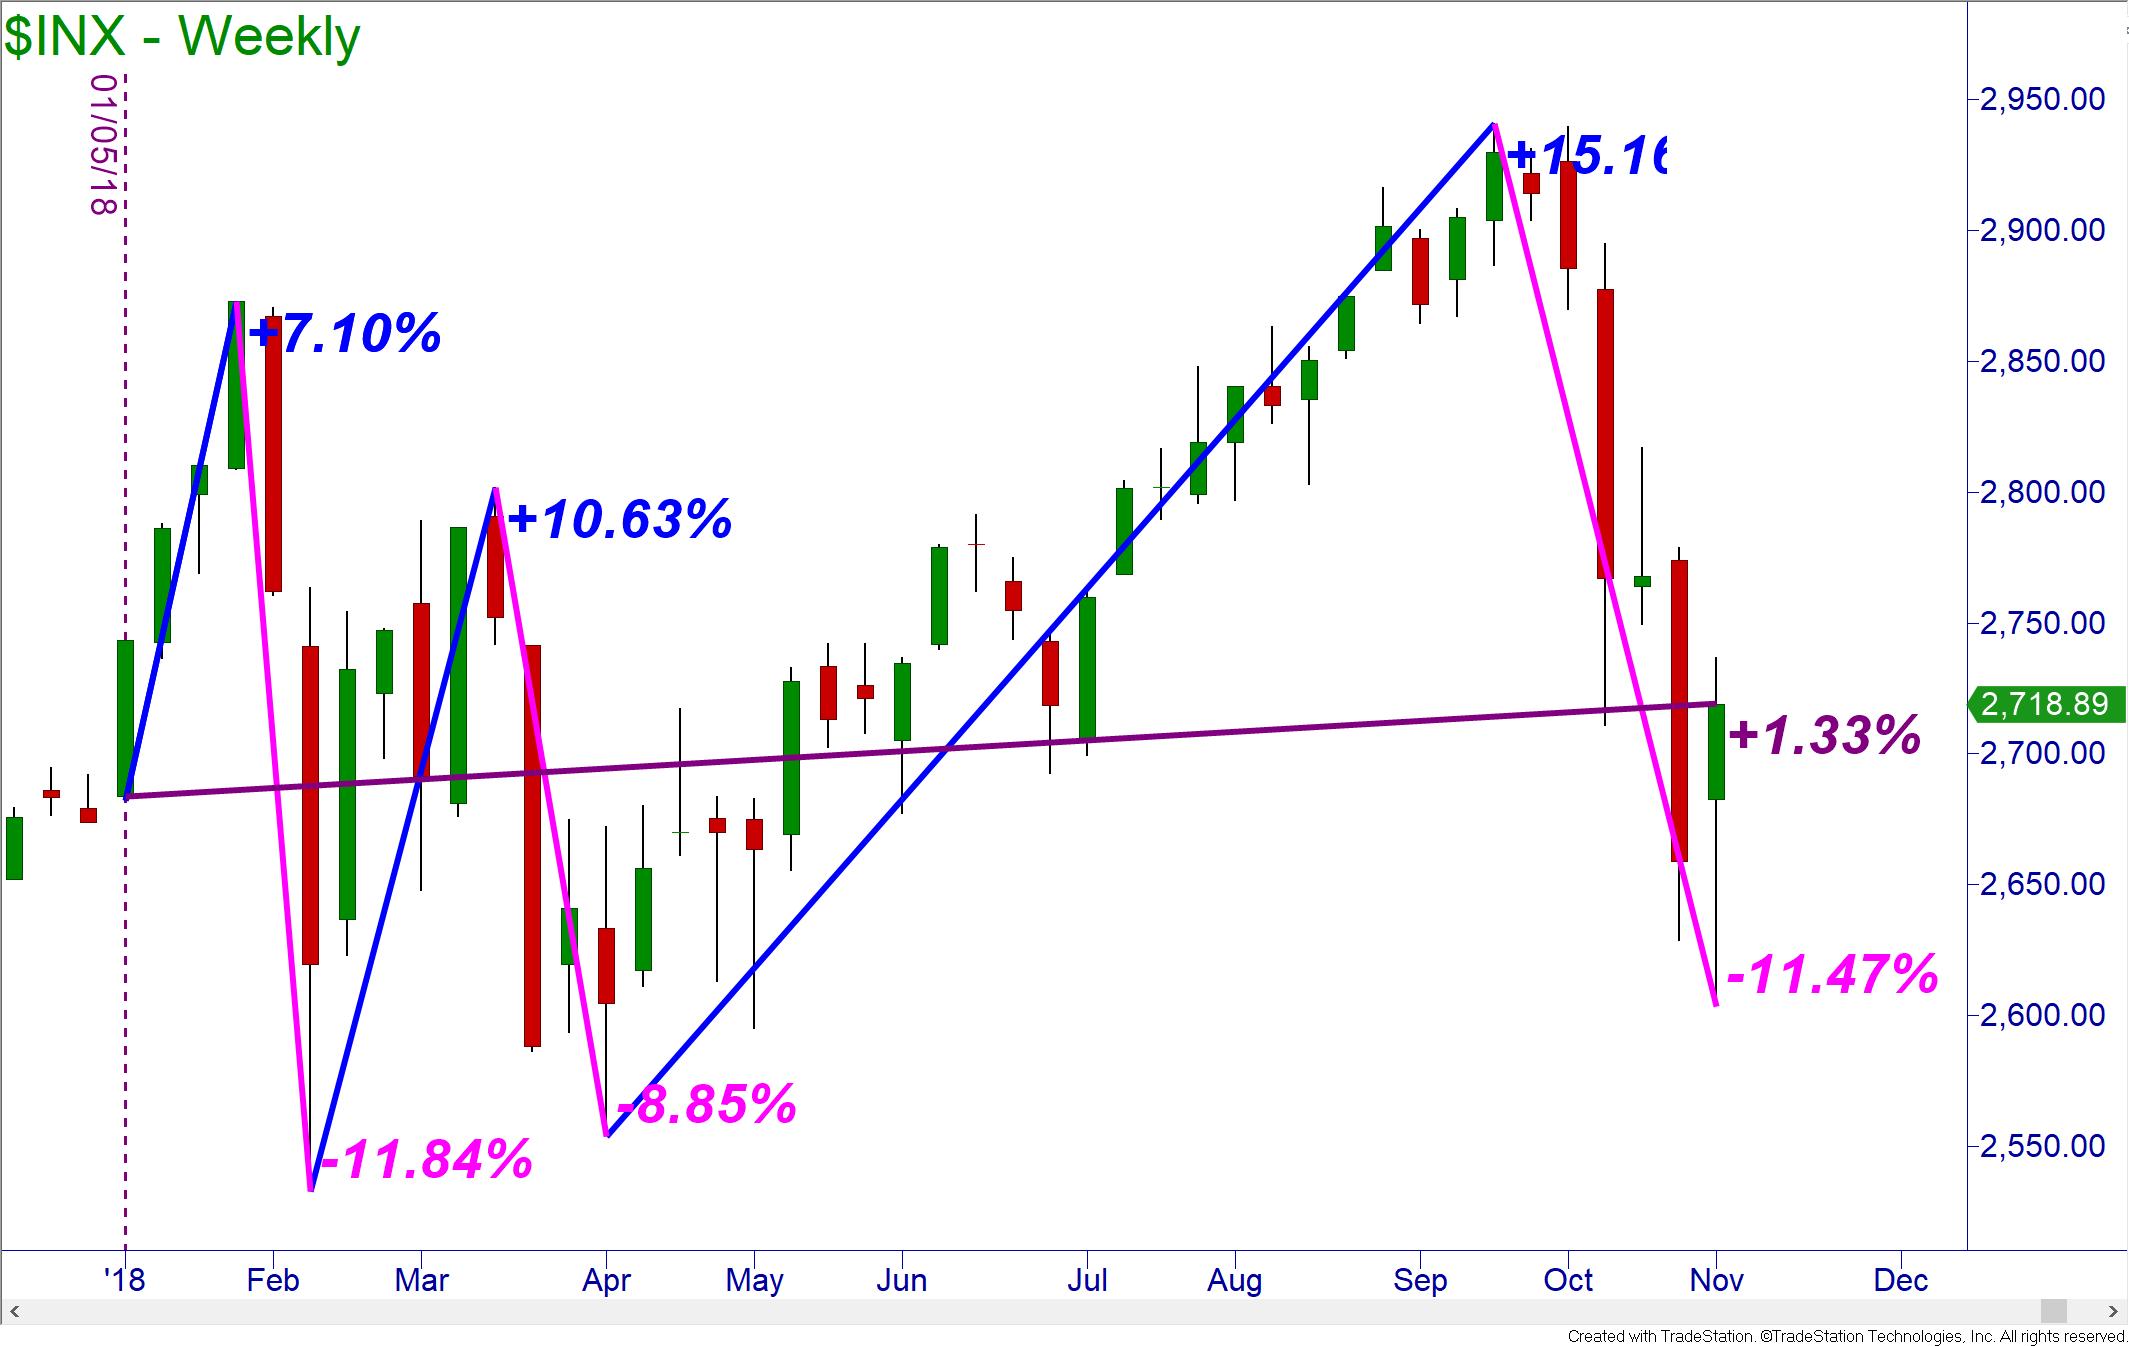
Investors and traders have been extremely nervous watching the markets recently and wondering if we are headed for a market crash. From the beginning of the year to the end of October, the S&P 500 Index is only up a little over one percent. You would think that this was a mild year, but after investors put down their bottle of Pepto, they will tell you it has been a wild ride. The average swing between highs and lows has been 10.8%.
So, the big question accompanying the recent drop in price is whether this is just a simple correction or the start of a bear market? Before I declare either, let’s look at what the markets are telling us. After all, the key to where the markets are likely to go is within the market itself. Economic reports and company data are delayed data. What gives us a glimpse into the future and clues us in to the onset of a market crash is the price action on the chart itself.
Looking to the S&P 500 index, the monthly chart is not telling us to panic. I am using the RSI as a momentum indicator and the 13-period exponential moving average to assist with the trend identification. On the monthly chart, the 13 EMA will show you the approximate yearly trend. Notice how when prices closed below the 13 EMA, the index made a lower low in price before resuming the overall uptrend. This does not suggest a bear market but would warn of weakness and the potential for that bear market to begin. In October, the index DID NOT close below the EMA.
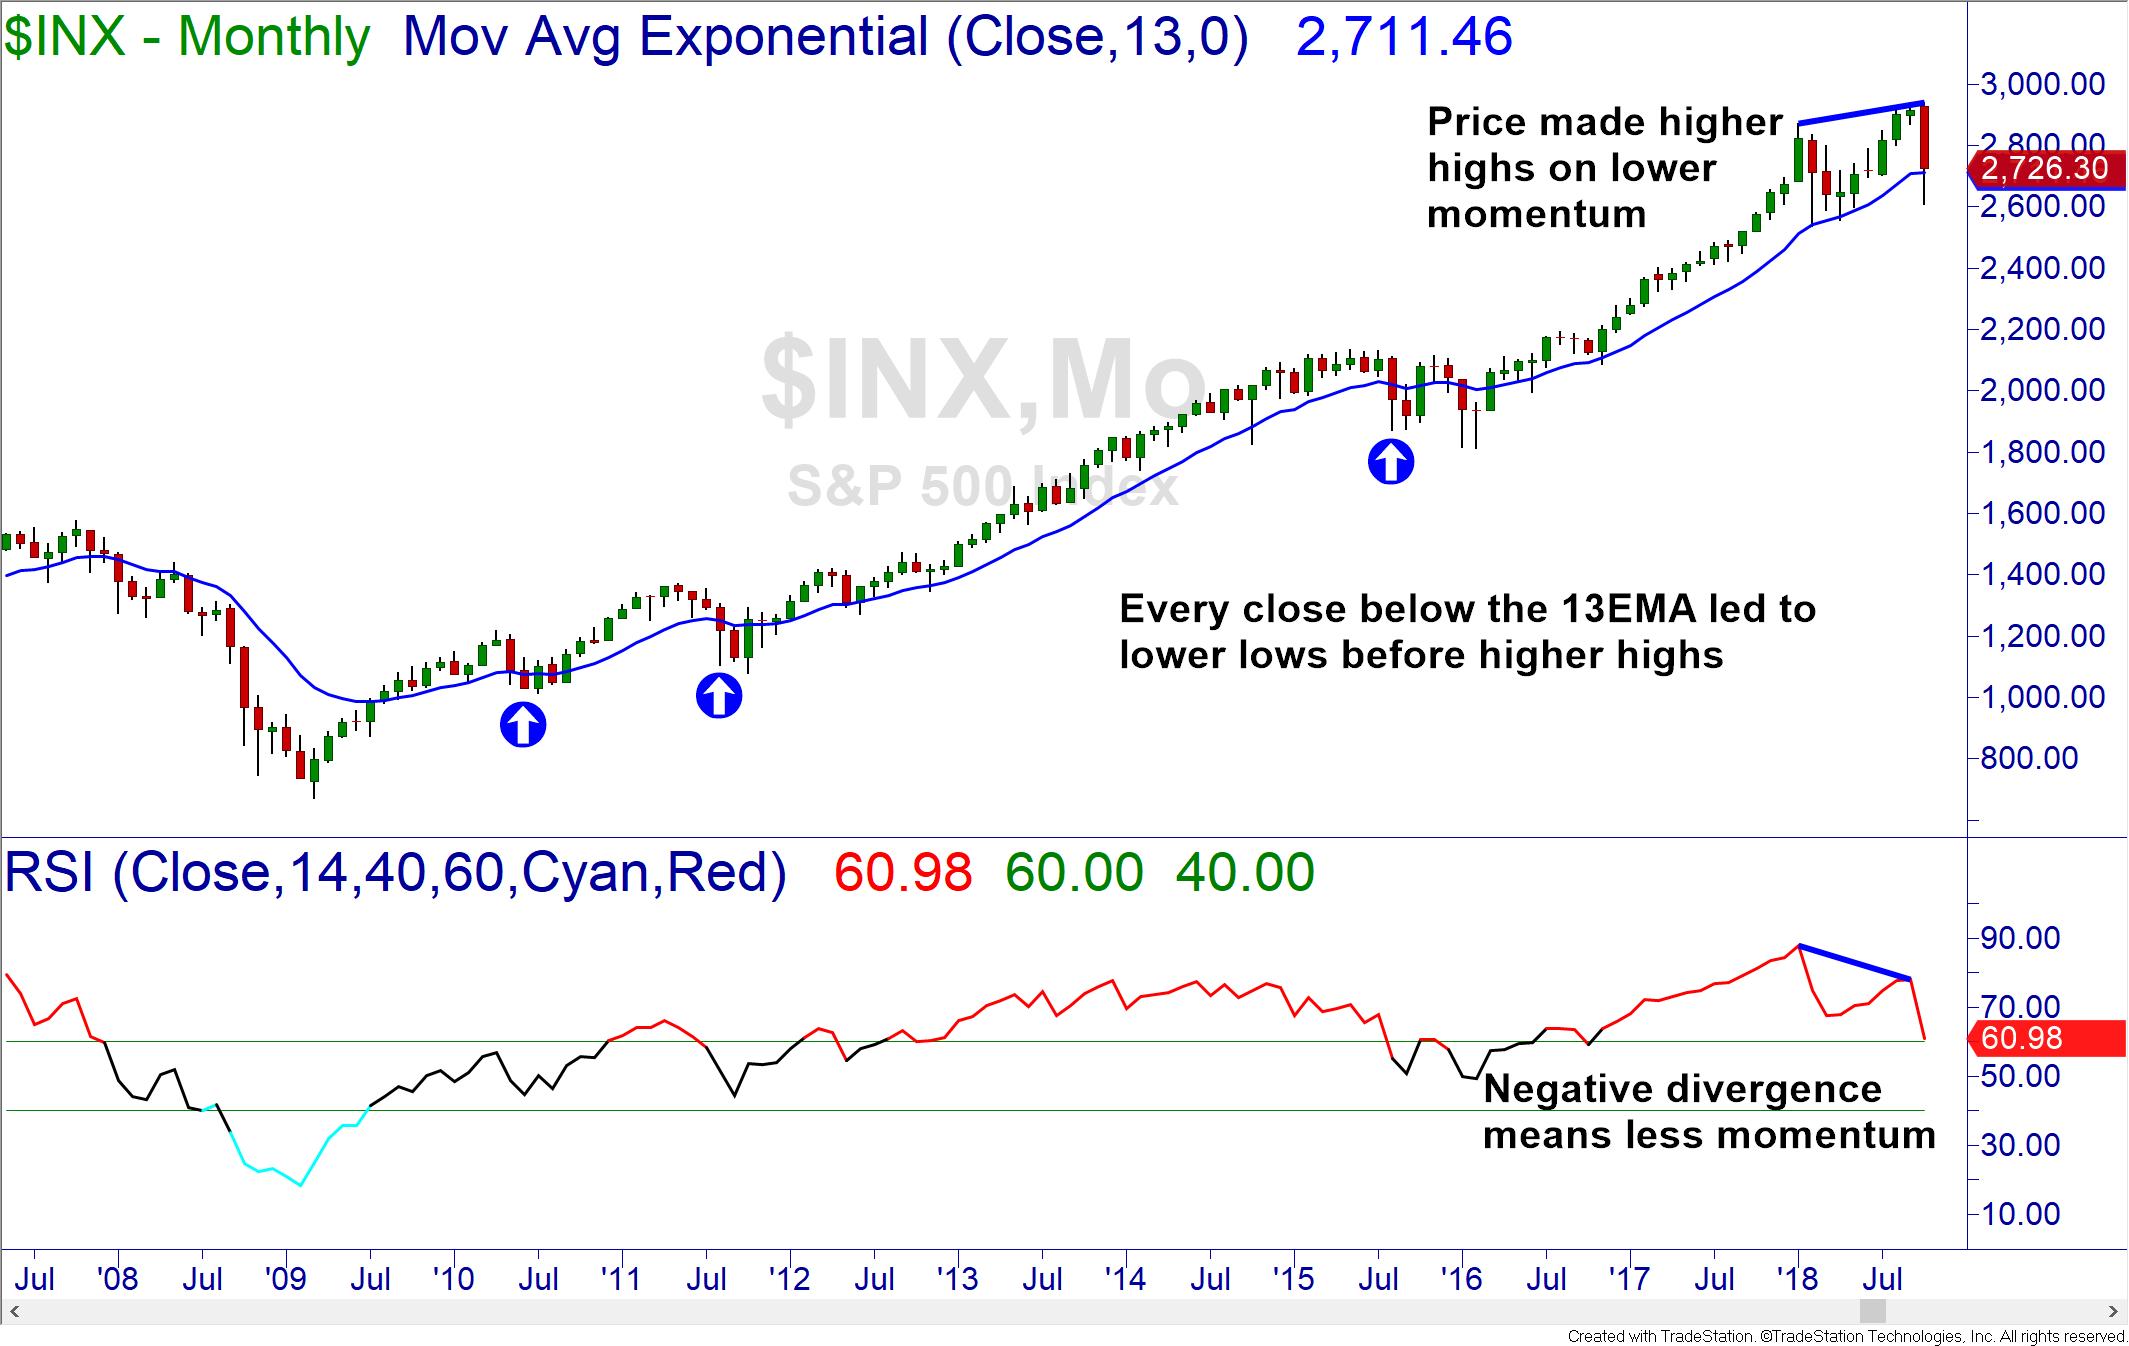
Looking at the RSI, we see a major momentum warning. When prices are making higher highs in an uptrend, they should be doing it with increased momentum. On the chart above, the RSI is showing the higher highs in September and October were made with less bullish momentum. This is a signal called negative divergence and is very bearish, a good indicator that a market crash may be nearing. . Since the divergence occurred while the indicator was reading above 60, no new lows should be made before another rally.
So, the S&P is in a correction and should be able to make some more rallies before we get a bear market. Last week I tweeted, (@traderbdub) that the S&P futures bounced from a daily demand and will seek out a supply zone at 2767 before selling off. The next daily demand is 2510 on the index.

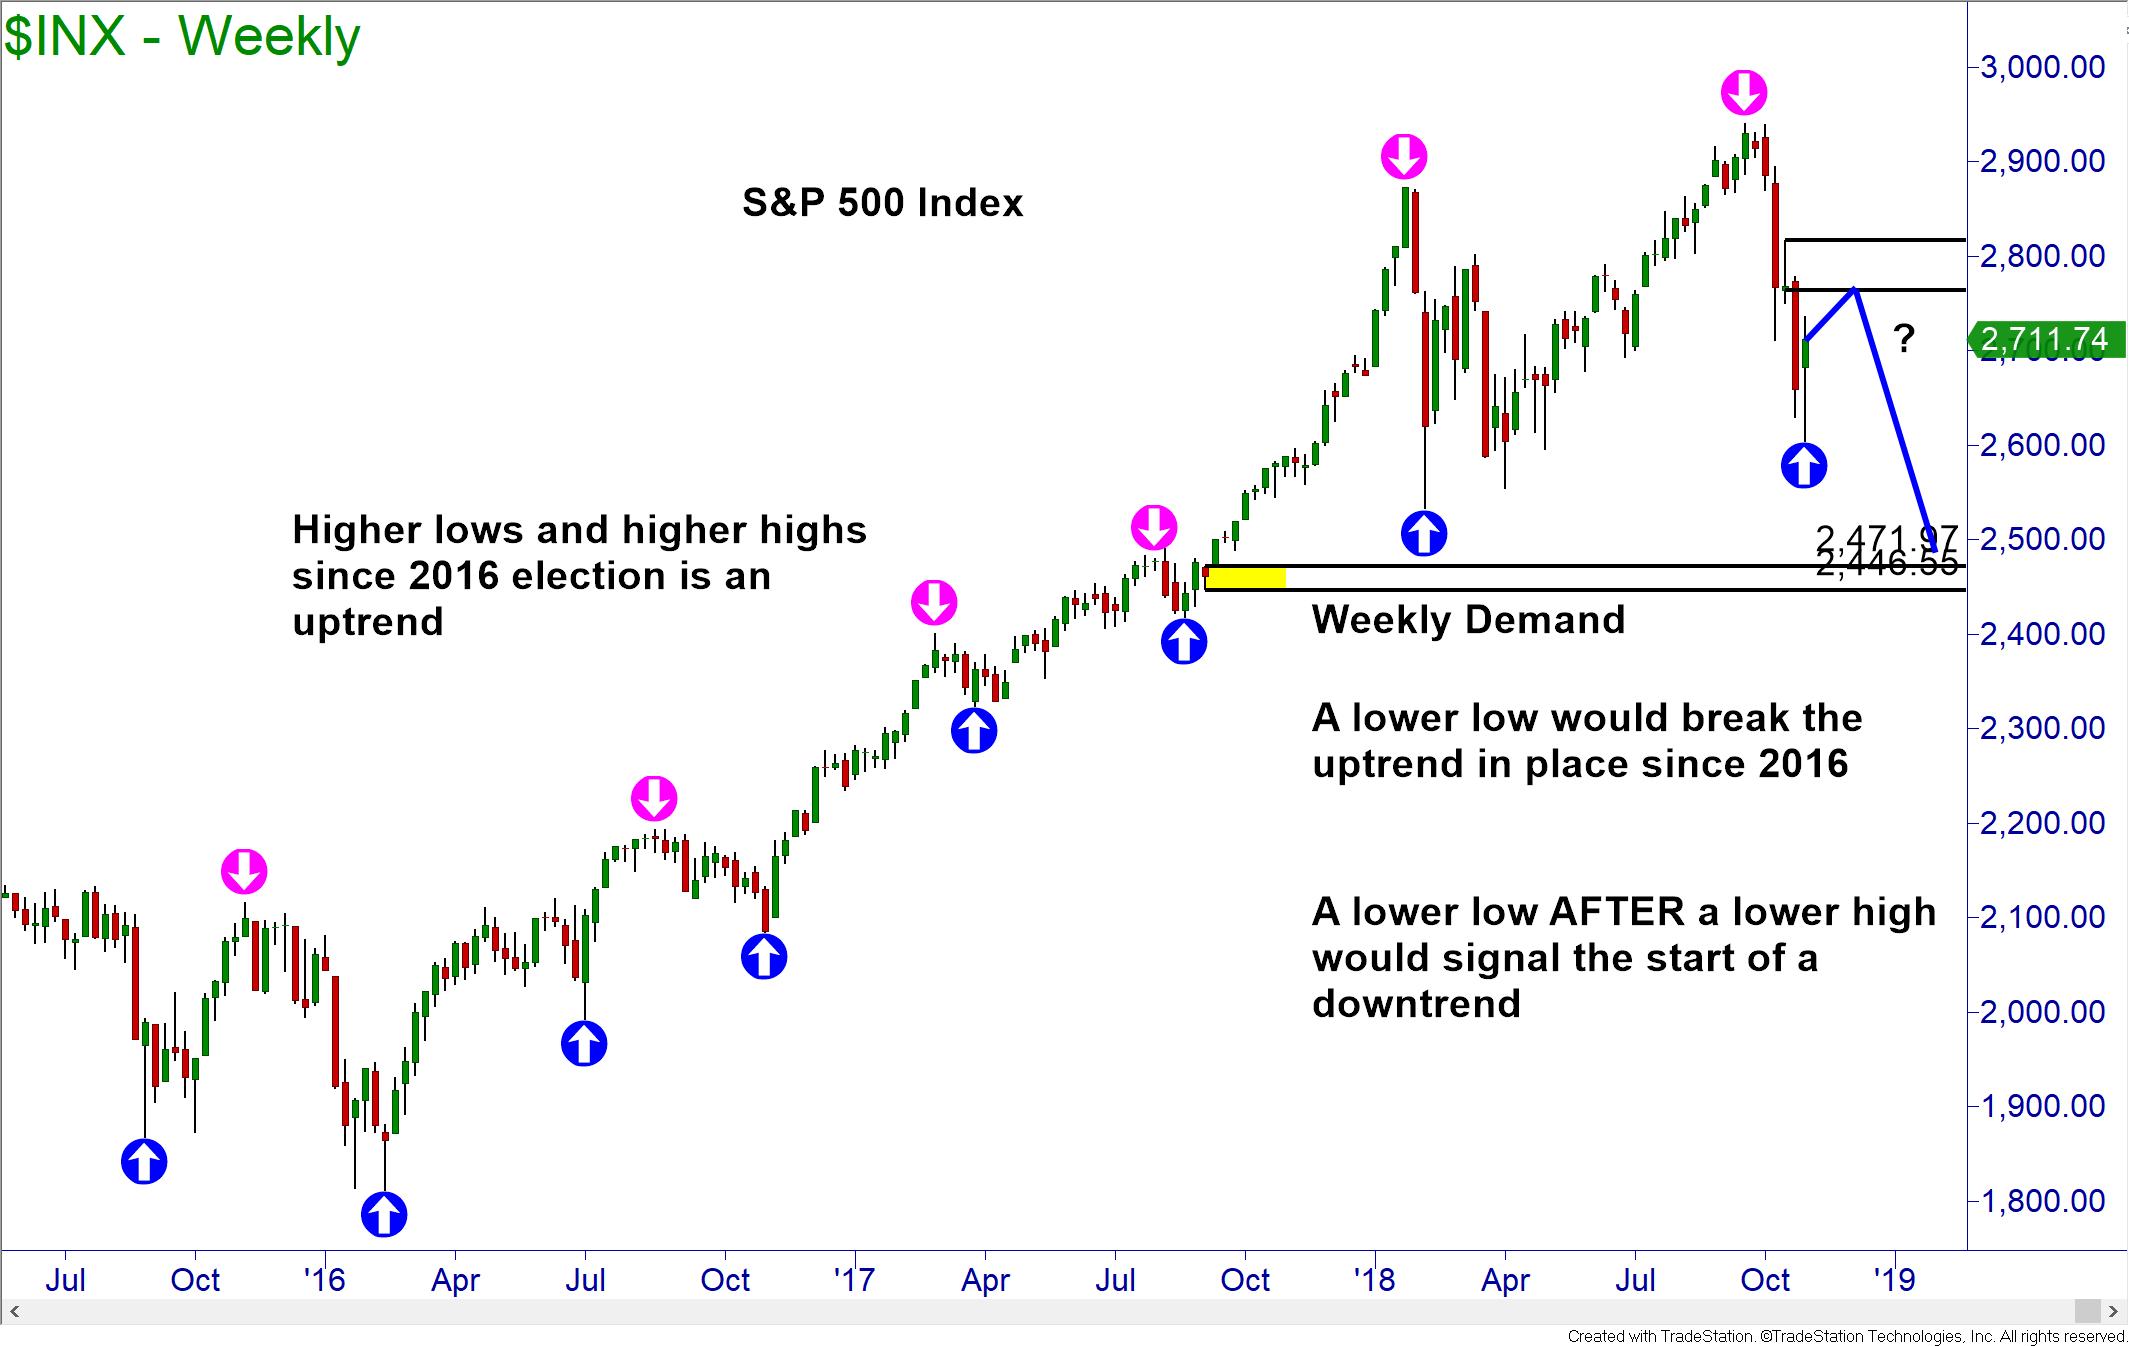
Now we will have to watch this price movement carefully. If prices simply break the February 2018 lows, then the weekly uptrend that has been in place since the 2016 election will have been broken. However, if price makes a lower high before making the lower low, that would be the signal of the start of a bear market.
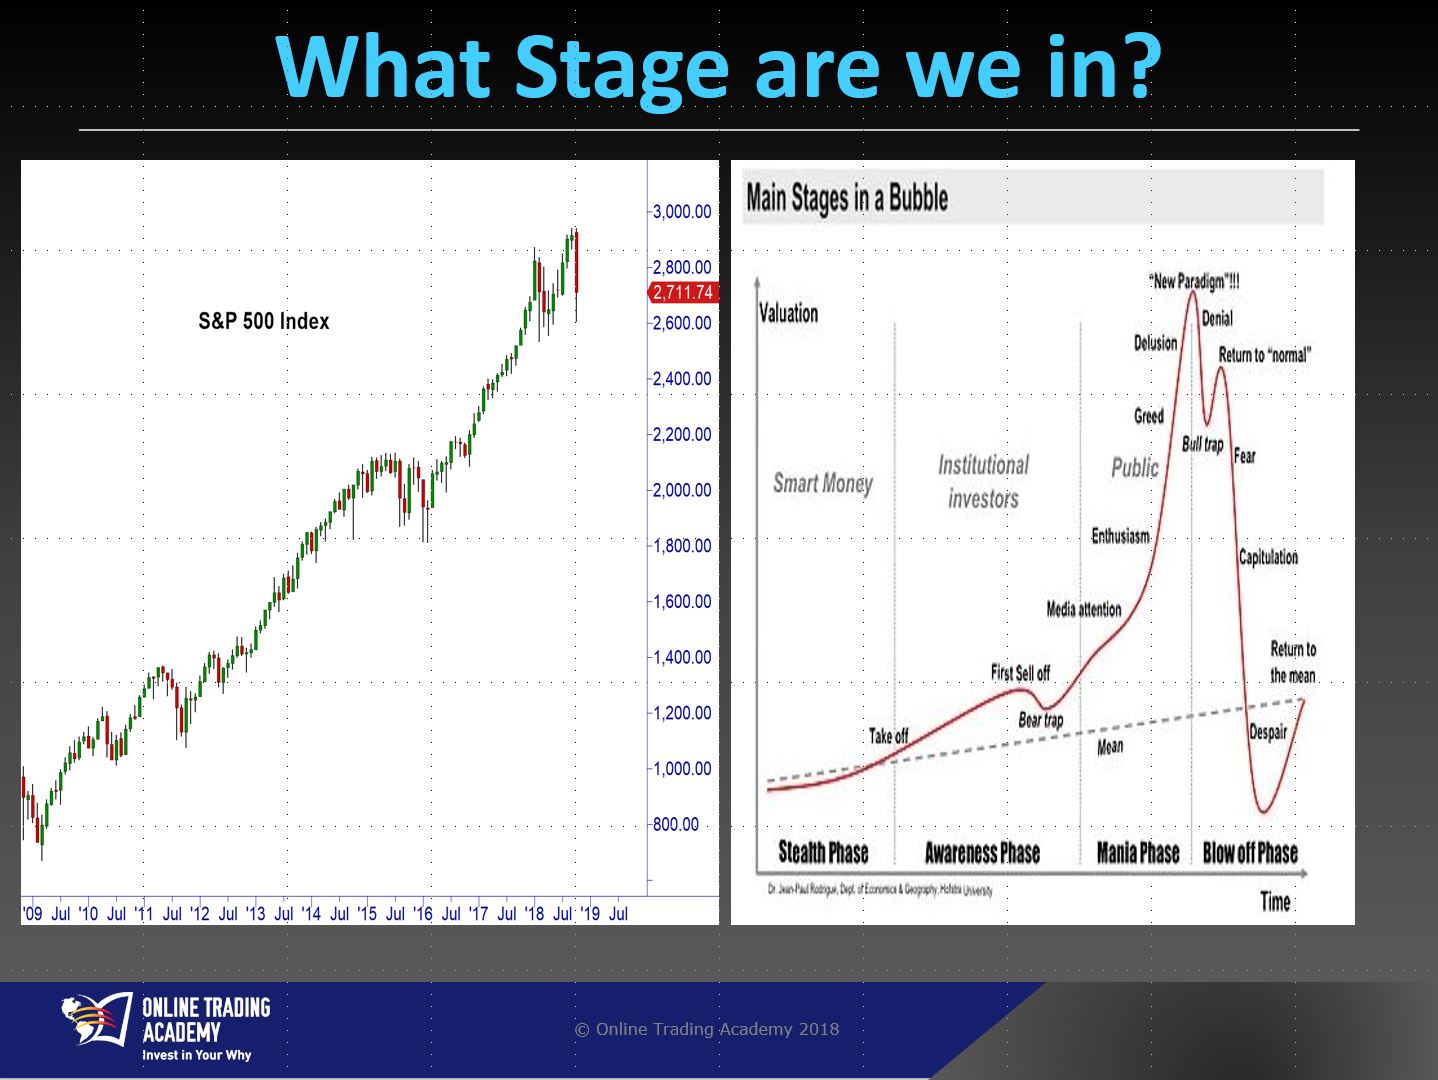
For now, the S&P is only showing a correction in price. But that could easily change. What is scary is how close the current chart looks like the typical map of a price bubble.
If you were wondering about the other major market indexes, the Dow Jones and the Nasdaq Composite indexes are exhibiting the same patterns and price action as the S&P 500.

So, for now, the markets are correcting but this is eerily close to signaling the start of the bear market and potential recession in the economy. Bear markets are not to be feared but rather they offer great opportunities to the educated and skillful traders and investors. To build the required skills to navigate a market crash, you need knowledge. You also need the experience to build skill. You gain this experience by practicing with the help of a mentor. Build your skill so you can take advantage of the market opportunities by joining Online Trading Academy today.
Read the original article here - Market Crash or Correction?
Neither Freedom Management Partners nor any of its personnel are registered broker-dealers or investment advisers. I will mention that I consider certain securities or positions to be good candidates for the types of strategies we are discussing or illustrating. Because I consider the securities or positions appropriate to the discussion or for illustration purposes does not mean that I am telling you to trade the strategies or securities. Keep in mind that we are not providing you with recommendations or personalized advice about your trading activities. The information we are providing is not tailored to any individual. Any mention of a particular security is not a recommendation to buy, sell, or hold that or any other security or a suggestion that it is suitable for any specific person. Keep in mind that all trading involves a risk of loss, and this will always be the situation, regardless of whether we are discussing strategies that are intended to limit risk. Also, Freedom Management Partners’ personnel are not subject to trading restrictions. I and others at Freedom Management Partners could have a position in a security or initiate a position in a security at any time.
Editors’ Picks

EUR/USD: US Dollar to remain pressured until uncertainty fog dissipates
Unimpressive European Central Bank left monetary policy unchanged for the fifth consecutive meeting. The United States first-tier employment and inflation data is scheduled for the second week of February. EUR/USD battles to remain afloat above 1.1800, sellers moving to the sidelines.

GBP/USD softens to near 1.3600 as BoE hints further rate cuts
The GBP/USD pair loses ground to near 1.3610 during the early Asian session on Monday. The Pound Sterling softens against the Greenback amid growing expectations of the Bank of England’s interest-rate cut. Traders will take more cues from the Fedspeak later on Monday.

USD/JPY drops back below 157.00 on Japan's verbal intervention
USD/JPY has come under moderate selling pressure below 157.00 in the Asian session on Monday. The Japanese Yen lost ground to near 157.70 following Japan’s ruling Liberal Democratic Party's outright majority win in Sunday’s lower house election, opening the door to more fiscal stimulus by Prime Minister Sanae Takaichi. However, JPY buyers jumped back and dragged the pair southward on FX verbal intervention by Japan’s Finance Minister Katayama.
Editors’ Picks
USD/JPY drops back below 157.00 on Japan's verbal intervention
USD/JPY has come under moderate selling pressure below 157.00 in the Asian session on Monday. The Japanese Yen lost ground to near 157.70 following Japan’s ruling Liberal Democratic Party's outright majority win in Sunday’s lower house election, opening the door to more fiscal stimulus by Prime Minister Sanae Takaichi. However, JPY buyers jumped back and dragged the pair southward on FX verbal intervention by Japan’s Finance Minister Katayama.

Gold holds gains near $5,000 as China's gold buying drives demand
Gold price clings to the latest uptick near $5,000 in Asian trading on Monday. The precious metal holds its recovery amid a weaker US Dollar and rising demand from the Chinese central bank. The delayed release of the US employment report for January will be in the spotlight later this week.

AUD/USD: Buyers eyes 0.7050 amid upbeat mood
AUD/USD builds on Friday's goodish rebound from sub-0.6900 levels and kicks off the new week on a positive note, with bulls awaiting a sustained move and acceptance above mid-0.7000s before placing fresh bets. The widening RBA-Fed divergence, along with the upbeat market mood, acts as a tailwind for the risk-sensitive Aussie amid some follow-through US Dollar selling for the second straight day.

Bitcoin Weekly Forecast: The worst may be behind us
Bitcoin price recovers slightly, trading at $65,000 at the time of writing on Friday, after reaching a low of $60,000 during the early Asian trading session. The Crypto King remained under pressure so far this week, posting three consecutive weeks of losses exceeding 30%.

Weekly column: Saturn-Neptune and the end of the Dollar’s 15-year bull cycle
Tariffs are not only inflationary for a nation but also risk undermining the trust and credibility that go hand in hand with the responsibility of being the leading nation in the free world and controlling the world’s reserve currency.
RECOMMENDED LESSONS
Making money in forex is easy if you know how the bankers trade!
I’m often mystified in my educational forex articles why so many traders struggle to make consistent money out of forex trading. The answer has more to do with what they don’t know than what they do know. After working in investment banks for 20 years many of which were as a Chief trader its second knowledge how to extract cash out of the market.
5 Forex News Events You Need To Know
In the fast moving world of currency markets where huge moves can seemingly come from nowhere, it is extremely important for new traders to learn about the various economic indicators and forex news events and releases that shape the markets. Indeed, quickly getting a handle on which data to look out for, what it means, and how to trade it can see new traders quickly become far more profitable and sets up the road to long term success.
Top 10 Chart Patterns Every Trader Should Know
Chart patterns are one of the most effective trading tools for a trader. They are pure price-action, and form on the basis of underlying buying and selling pressure. Chart patterns have a proven track-record, and traders use them to identify continuation or reversal signals, to open positions and identify price targets.
7 Ways to Avoid Forex Scams
The forex industry is recently seeing more and more scams. Here are 7 ways to avoid losing your money in such scams: Forex scams are becoming frequent. Michael Greenberg reports on luxurious expenses, including a submarine bought from the money taken from forex traders. Here’s another report of a forex fraud. So, how can we avoid falling in such forex scams?
What Are the 10 Fatal Mistakes Traders Make
Trading is exciting. Trading is hard. Trading is extremely hard. Some say that it takes more than 10,000 hours to master. Others believe that trading is the way to quick riches. They might be both wrong. What is important to know that no matter how experienced you are, mistakes will be part of the trading process.
The challenge: Timing the market and trader psychology
Successful trading often comes down to timing – entering and exiting trades at the right moments. Yet timing the market is notoriously difficult, largely because human psychology can derail even the best plans. Two powerful emotions in particular – fear and greed – tend to drive trading decisions off course.