MACD- How to Use It and More

In this article, I will walk you through one of the most popular trading indicators out there- MACD. As with the Stochastic indicator, I want to specify that I am not covering the functionality of this indicator for you to immediately start using MACD.
How to use MACD
The purpose of this article is purely educational, so you can understand what stands behind MACD. I am going to choose a more unconventional way to write this article and start with two examples of a long and a short trade. By the end of the article, you will be able to answer why those trades were taken and be an expert of how MACD is used. Here are the examples…
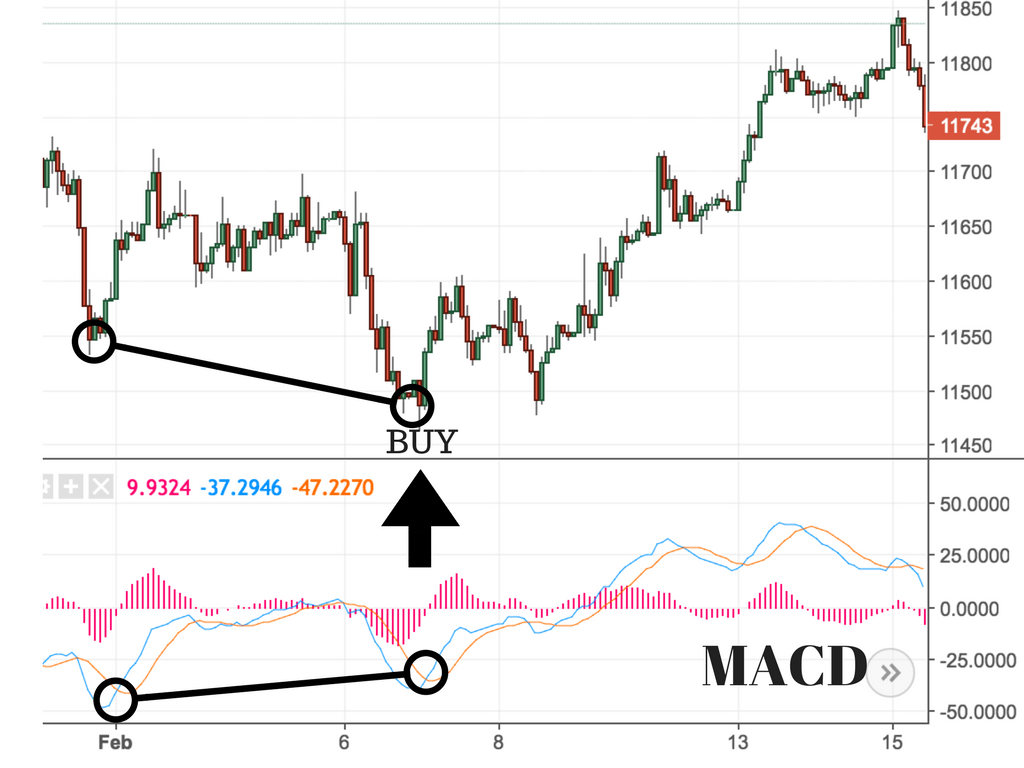
EXAMPLE 1: Long Trade in DAX
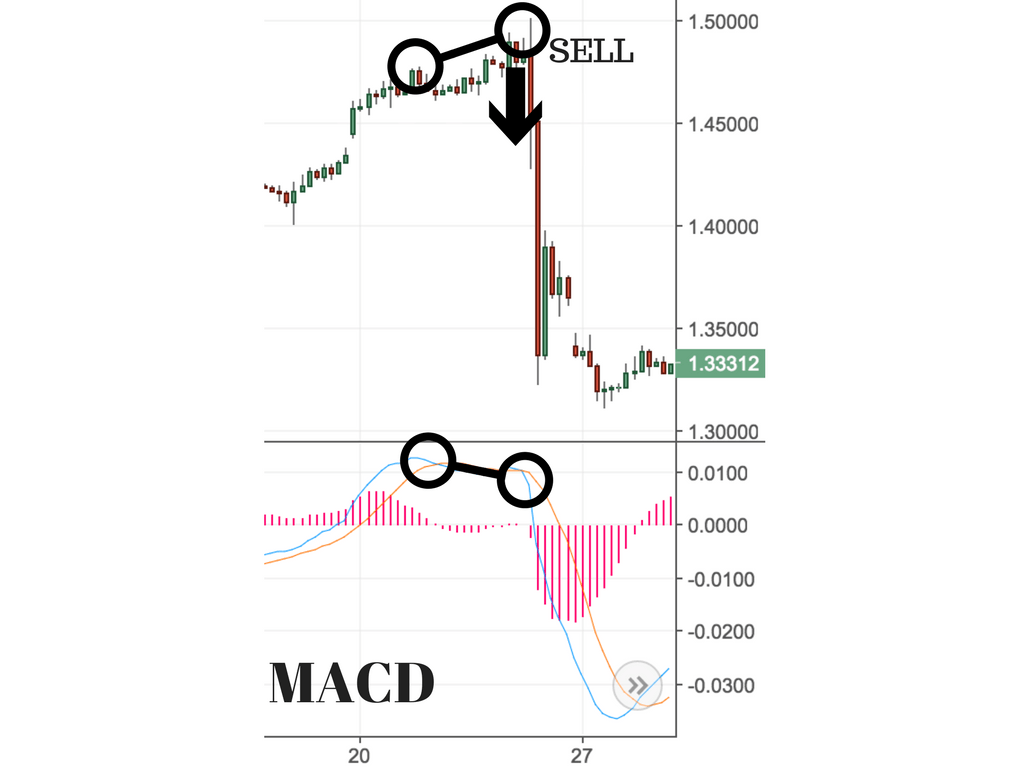
EXAMPLE 2: Short Trade in GBPUSD
MACD- How the name of the indicator was born
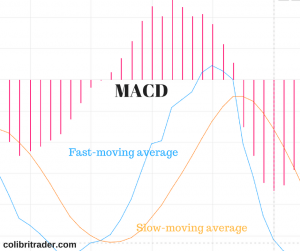
The histogram is just a diagram that shows the difference between the quick and slow moving average. Looking at the original chart, you can see that, the histogram gets bigger, as the two moving averages separated.
This is called divergence because the faster/quicker moving average is “diverging” or moving away from the slower moving average.
While the moving averages get nearer to each other, the histogram gets smaller. This is called convergence because the faster moving average is “converging” or coming together or getting closer to the slower moving average.
And that is how MACD was born- Moving Average Convergence Divergence!
MACD can be pronounced as either “Mac-Dee” or “M-A-C-D.”
Origin:
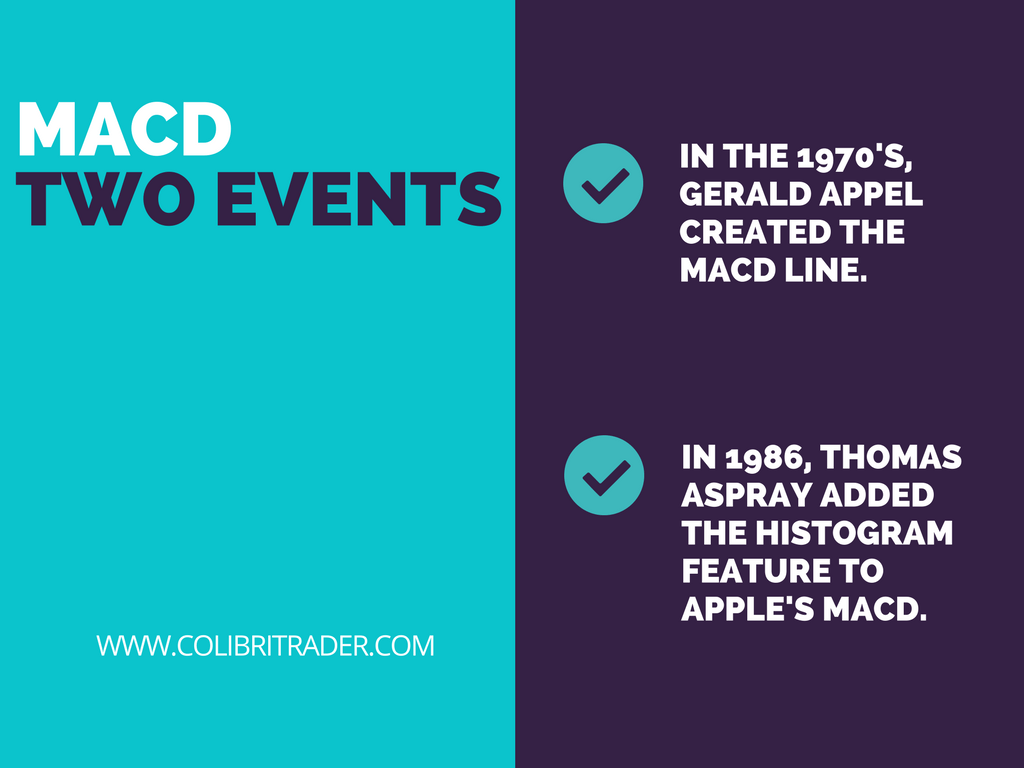
The creation of the MACD as we know it can be split into two separate events.
-
In the 1970’s, Gerald Appel created the MACD line.
-
In 1986, Thomas Aspray added the histogram feature to Apple’s MACD.
Thomas Aspray’s contribution served as a way to look forward to (and therefore cut down on lag) possible MACD crossovers which are a deep-seated part of the indicator.
Meaning:
Moving average convergence divergence (MACD) is a trend-following momentum indicator that shows the relationship between two moving averages of prices. It is used to spot a change in the short-term trend of the market.
Methods to Interpret:
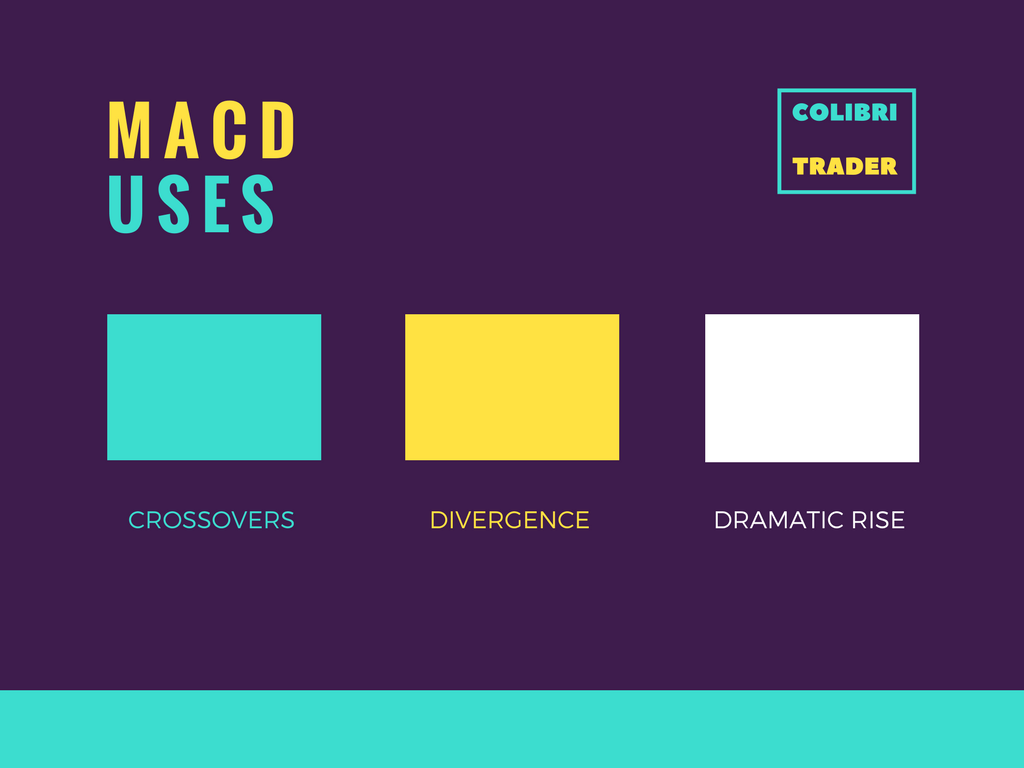
There are three widespread methods used to infer the MACD:
-
Crossovers – When the MACD drops under the signal line, it is a bearish signal, which points out that it may be time to sell. On the other hand, when the MACD rises higher than the signal line, the indicator gives a bullish signal, which suggests that the price of the asset is likely to experience growing momentum. Many traders wait for a “confirmation cross” above the signal line before entering into a position to stay away from getting “faked out” or entering into a position too early.
-
Divergence – This happens when the security price diverges from the MACD. It indicates the end of the existing trend and possibly the beginning of a new one.
-
Dramatic rise – When the MACD rises dramatically – that is, the shorter moving average drags away from the longer-term moving average – it is a signal that the security is overbought and will soon come back to normal levels.
How to use MACD:
With an MACD chart, you will usually see three numbers that are used for its settings.
-
The first is the number of periods that is used to calculate the faster moving average.
-
The second is the number of periods that is used in the slower moving average.
-
And the third is the number of bars that is used to compute the moving average of the diversity between the faster and slower moving averages.
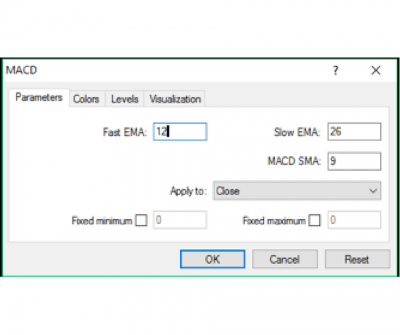
The default settings for the MACD indicator are:
-
Slow moving average – 26 days
-
Fast moving average – 12 days
-
Signal line – 9 day moving average of the variation among the fast and slow
-
Every moving average is exponential
MACD Formula:
The MACD indicator is designed as the difference between the fast moving averages and slow moving averages:
MACD = 12 Day exponential moving average – 26 Day exponential moving average
The signal line is calculated as a 9 day exponential moving average of MACD.
Calculation:
The MACD is calculated by deducting the 26-day exponential moving average (EMA) from the 12-day EMA. A nine-day EMA of the MACD, identified as the “signal line”, is then designed on top of the MACD, performance as a trigger for buy and sell signals.
Why to use MACD?
The MACD is a mixture of both trends. The short-term moving average accounts for most of MACD movement as it rapidly reacts to price changes.
It would not be feasible to look at each and every stock to mark the trend. Beginners have to use MACD for identifying the short-term as well as intermediate trend, say of three to five weeks, only. Take only those short-term MACD signals which are in the same direction as the higher timeframe trend.
For example: If the higher timeframe trend is upward, one ought to take only buy signals and the higher timeframe trend is downward, one ought to take only sell signals. This would help avoid whipsaws.
When not to use MACD:
MACD is a trouble-free and trendy tool used to identify short-term price trends. “However, in dull and lacklustre range-bound markets, avoid the MACD indicator as it would create a lot of whipsaws,” as the definition goes.
Among all the secondary oscillators, the MACD is one of the finest and most trustworthy indicators to spot a trend early and is also easy to read.
Make use of MACD with other indicators:
Although the MACD is effective, it is not complete in itself. The MACD indicator may not be enough to take a trade or close a trade. Traders must use other indicators to take decisions. Traders should bring into play other indicators such as RSI, Fibonacci series, candlestick patterns, Bollinger Bands, and Stochastic to validate any trend. Price action is a great way to check objectively where you are standing. As most of you already know- I am sticking mostly to price action for a reason!
No one indicator can ever compose sound investment logic on its own. Each one of the technical indicators is fundamentally lagging interpretation of market direction. You can easily spot that one signal on a certain indicator would be directly opposing a signal on another indicator, making it extremely hard to arrive at a trading conclusion not based on the hindsight bias. Hence, using too many indicators is blurring the vision of the trader. Sticking to what already works should be the aim of the winning trader. No matter how beautiful indicators look on our charts, we should be reasonable and run trading as a very serious business.
How to Trade Using MACD
There are two moving averages with different “speeds”; the faster one will obviously be quicker to react to price movement than the slower one.
When a new trend takes place, the quick line will react first and ultimately cross the slower line. When this “crossover” happens, the fast line begins to “diverge” or else travels away from the slower line, it repeatedly points out that a new trend has formed.
From the chart on the right, you can see that the fast line crossed beneath the slow line and correctly called a new uptrend. Notice that when the lines crossed, the histogram temporarily fades away. This is because the variation between the lines at the time of the cross is 0. As the downtrend starts and the fast line diverges away from the slow line, the histogram gets bigger, which is excellent indication of a strong trend.
Useful terminology to be known:
Signal-line crossover:
A “signal-line crossover” takes place when the MACD and average lines cross; that is, when the divergence (the bar graph) transforms sign. The standard interpretation of such an occurrence is a recommendation to buy, if the MACD line crosses above through the average line (a “bullish” crossover), or to sell if the MACD line crosses downwards through the average line (a “bearish” crossover). These events are taken as signals that the trend in the stock is about to speed up in the direction of the crossover.
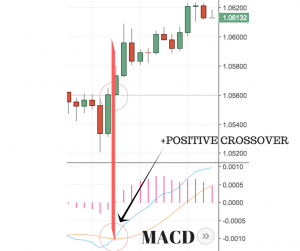
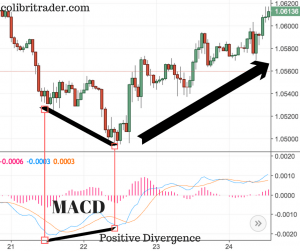
Bullish (or Positive) crossover Chart :
We can see how a buy entered after the bullish cross over is profitable. This can also be used to manage or close a short entered already.
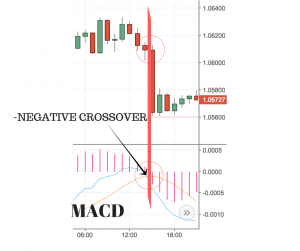
Bearish (or Negative) crossover Chart:
The chart above shows how the bearish crossover can be used for short entry or to manage /close a long entry taken already.
Zero crossover:
A “zero crossover” event takes place when the MACD series modifies sign, that is, the MACD line crosses the horizontal zero axis. This occurs when there is no difference between the fast and slow Exponential Moving Averages of the price series. A transform from positive to negative MACD is interpreted as “bearish”, and from negative to positive MACD is interpreted as “bullish”. Zero crossovers provide confirmation of a change in the direction of a trend but less proof of its momentum than a signal line crossover.
Divergence:
“Divergence” denotes the two underlying moving averages moving away from each other.
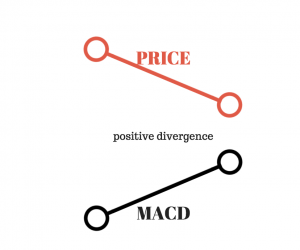
- Positive divergence:
A “positive divergence” or “bullish divergence” takes place when the price creates a new low but the MACD doesn’t authenticate with a new low of its own.
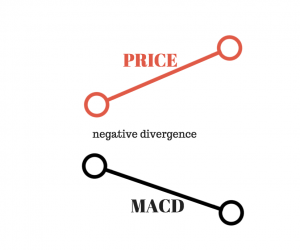
Negative divergence:
A “negative divergence” or “bearish divergence” takes place when the price creates a new high but the MACD doesn’t verify with a new high of its self.
A divergence with respect to price may arise on the MACD line and/or the MACD Histogram.
In the above chart we can see a bearish divergence.

Conclusion
The MACD indicator is largely popular tool in technical analysis, for the reason that it gives traders the ability to quickly and easily recognise the short-term trend direction. The clear transaction signals help reduce the subjectivity involved in trading, and the crosses over the signal line make it simple for traders to ensure that they are trading in the direction of momentum. Not many indicators in technical analysis have confirmed to be more trustworthy than the MACD, and this relatively simple indicator can quickly be incorporated into any short-term trading strategy.
Explanations of the trades from the beginning of this articles:
EXAMPLE 1: Long Trade in DAX
By now you should already have an explanation of why this trade was taken. Indeed,
this trade was taken because there was a positive divergence between the price and the MACD indicator. The price made a lower low, while the MACD indicator was making a second higher low, which led to the positive divergence. Such a divergence is a characteristic of an oversold market environment.
EXAMPLE 2: Short Trade in GBPUSD
The second trade was a short GBPUSD. The trade was taken, because there was a negative divergence between the price and the MACD indicator. As in the illustration on the left-hand side, you can try to imagine how the price is making a new high, while the MACD indicator is failing to make a new high. This results in a negative divergence and is a bearish signal.
Author

Colibri Trader
Colibri Trader
Colibri Trader, as he is known in the circles, is based in London, UK. He Started his career in one of the leading prop trading houses at the time and then has moved out to form his own company- Colibri Trader Limited.


