In the last few articles I wrote about using the information in the option chain. Some of the most important information is contained in the “Greeks,” the variables that describe how options react to various events. As I wrote then, the most important events in an option’s life and the variables that measure the reaction of options to those events are:
Actual changes in stock price. Measured by Delta.
Change in expectations for future stock price change. Measured by Vega.
Passage of time. Measured by Theta.
I noted that there are software tools that calculate these effects for us and allow us to visualize their results at a glance. Today we’ll look at those. First, we have to realize that to trade options profitably we have to have an opinion about what the price of a stock is most likely to do. Our opinion might be that the stock will go up, that it will go down or that it will stay in a range for a while.
Then we select an options strategy, from the dozens that are available, that will pay us if we are right in our opinion. Depending on how confident we are in that opinion, we can pick a strategy that will pay off big, but only if the stock proves us right; or we can pick one that has a more modest payoff, but will pay us even if we are a little bit wrong.
Before we commit money to our trade, we have to estimate how much we stand to make if we win versus how much we stand to lose. This is a bit more involved with options than it is with stocks. That’s why we need the tools to help us. Here’s an example.
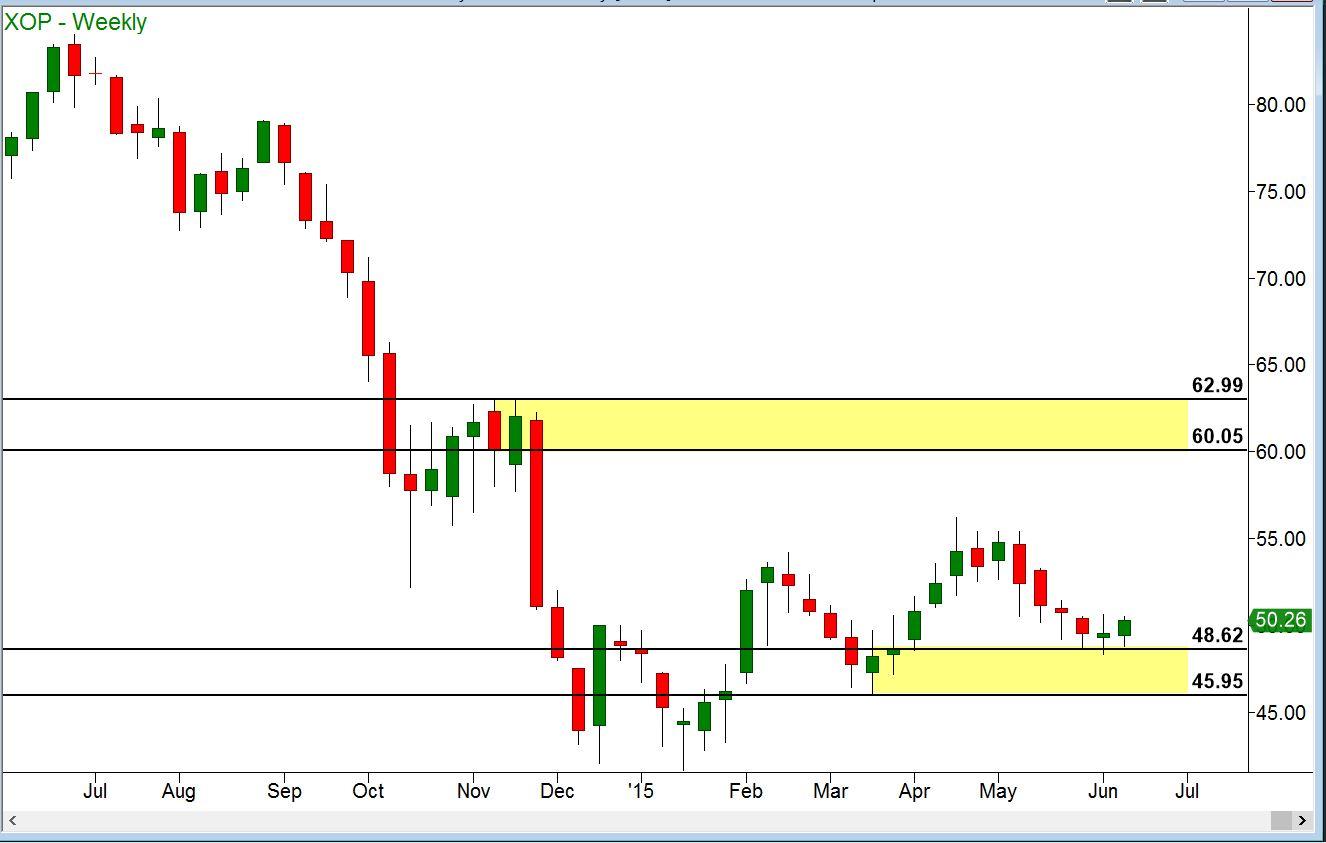
On June 10, 2015, the chart of XOP, the exchange-traded fund that invests in the stock of oil and gas exploration companies, looked like this:
Reacting to the price of oil, XOP had been grinding higher since mid-January after a dramatic drop in the second half of 2014. It had pulled back to a demand zone formed in March, which appeared to have a good chance of holding. If so, it might reach the $62.50 area within a few months. On the other hand, we would consider this emerging uptrend to have failed if XOP dropped below the low of its last bounce, at $45.95.
A simple option strategy would be to buy call options on XOP. Calls go up in value when the underlying stock does but cost far less. The catch is that call options expire at some fixed date so the move we expect has to happen before that.
On June 10, with XOP at $50.26, we could have bought the $50 call options with a December 2015 expiration date for $4.20 per share ($420 per hundred-share option contract). These gave us the right to buy XOP at $50 at any time until the third Friday in December.
Before committing real money to this trade, we needed to know how much we could make if we were right, and how much we could lose if we were wrong. If we do it right, the amount we would stand to lose would be considerably less than the $420 cost of a contract.
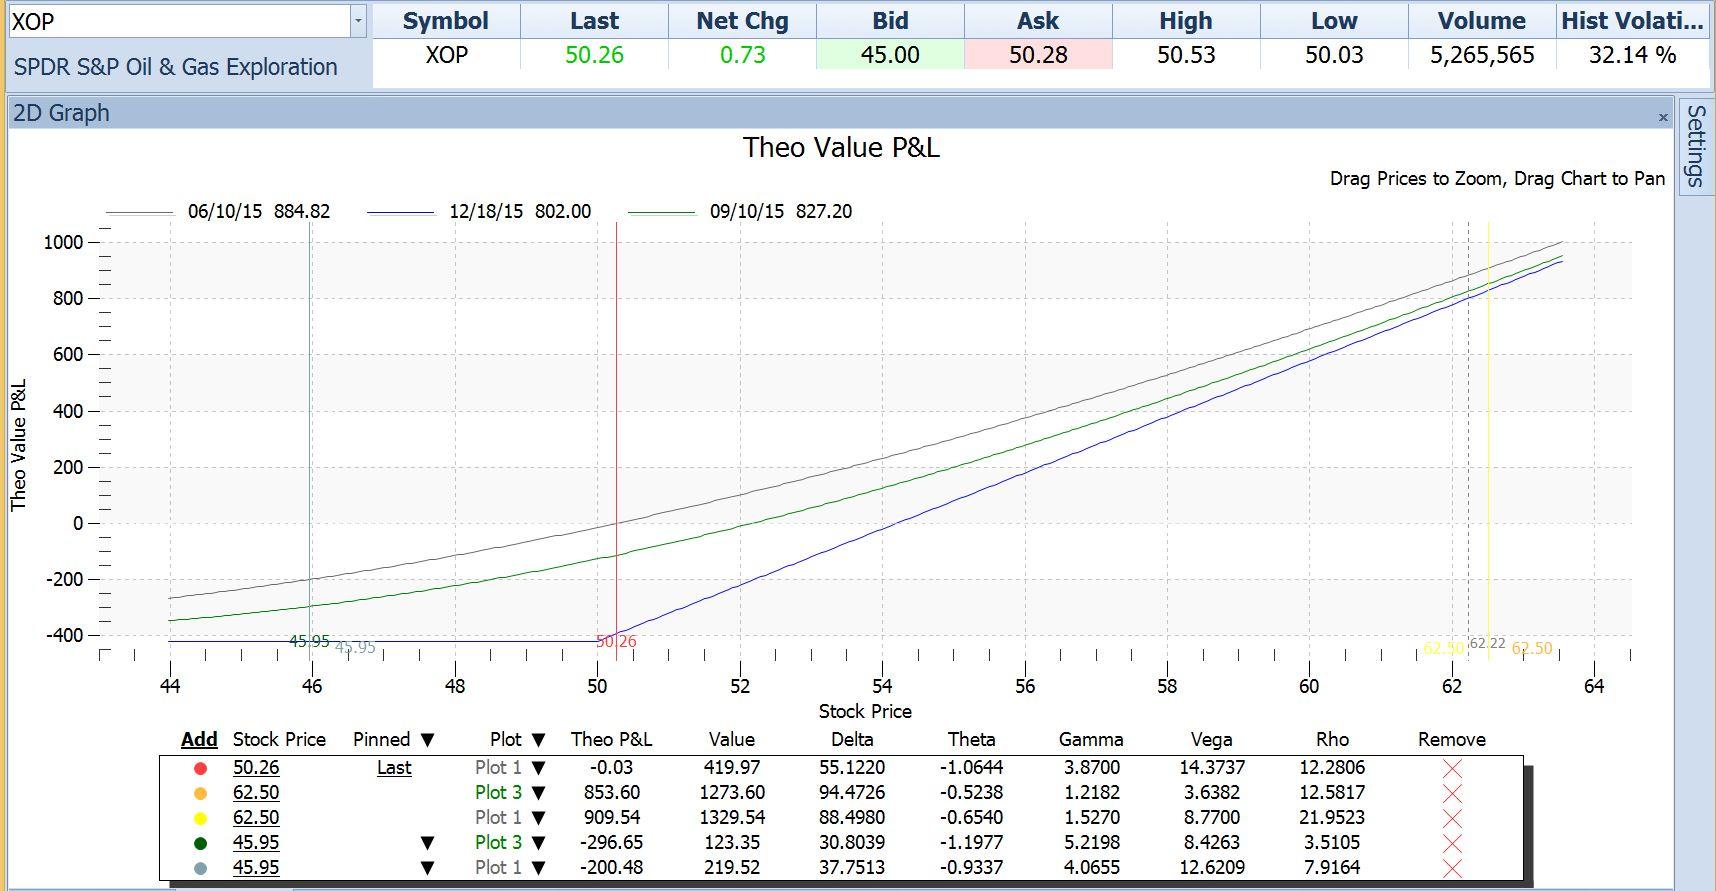
Below is an option payoff graph for this trade:
This graph shows what the profit or loss would be on the trade, assuming that we paid the $420 current price for the $50 calls, at any price of the stock. Profit/loss is on the vertical axis labeled “Theo Value P&L.” Stock prices are on the horizontal axis. The graph incorporates the effects measured by all of the Greeks and translates them into a visual form.
This graph and its associated table tell us everything we need to know about what could happen to this trade. It shields us from some very involved calculations and boils down the whole lot into answers to these simple questions: How much can I make if the stock does what I expect? How much can I lose if it doesn’t?
In this example, we are looking for a target price of $62.50, and we expect that it could take about three months to get there. The second row in the table says that if XOP were to be at a price of $62.50 three months from now, the Theo P&L would be $853.60 and that the Value of the option would be $1273.60. The fourth row in the table says that if XOP were to be at a price of $45.95 three months from now, the Theo P&L would be $-295.65, and that the Value of the option would be $123.35.
So there we have it. We could make $853.60 if XOP does what we expect; or we could lose $295.65 if instead XOP drops to the point where we would abandon the trade. It would have taken us a great deal of time to work out what the option price at some future date and stock price would be by applying each of the Greeks separately. That would be possible but not worth the trouble; and the trade would be gone by the time we figured it out. With the ability to draw this graph we can do it in seconds.
There is more that this chart tells us but that is a story for another day.
This content is intended to provide educational information only. This information should not be construed as individual or customized legal, tax, financial or investment services. As each individual's situation is unique, a qualified professional should be consulted before making legal, tax, financial and investment decisions. The educational information provided in this article does not comprise any course or a part of any course that may be used as an educational credit for any certification purpose and will not prepare any User to be accredited for any licenses in any industry and will not prepare any User to get a job. Reproduced by permission from OTAcademy.com click here for Terms of Use: https://www.otacademy.com/about/terms
Editors’ Picks

EUR/USD: US Dollar to remain pressured until uncertainty fog dissipates Premium
The EUR/USD pair lost additional ground in the first week of February, settling at around 1.1820. The reversal lost momentum after the pair peaked at 1.2082 in January, its highest since mid-2021.

Gold: Volatility persists in commodity space Premium
After losing more than 8% to end the previous week, Gold (XAU/USD) remained under heavy selling pressure on Monday and dropped toward $4,400. Although XAU/USD staged a decisive rebound afterward, it failed to stabilize above $5,000.

GBP/USD: Pound Sterling tests key support ahead of a big week Premium
The Pound Sterling (GBP) changed course against the US Dollar (USD), with GBP/USD giving up nearly 200 pips in a dramatic correction.

Bitcoin: The worst may be behind us
Bitcoin (BTC) price recovers slightly, trading at $65,000 at the time of writing on Friday, after reaching a low of $60,000 during the early Asian trading session. The Crypto King remained under pressure so far this week, posting three consecutive weeks of losses exceeding 30%.

Three scenarios for Japanese Yen ahead of snap election Premium
The latest polls point to a dominant win for the ruling bloc at the upcoming Japanese snap election. The larger Sanae Takaichi’s mandate, the more investors fear faster implementation of tax cuts and spending plans.
RECOMMENDED LESSONS
Making money in forex is easy if you know how the bankers trade!
I’m often mystified in my educational forex articles why so many traders struggle to make consistent money out of forex trading. The answer has more to do with what they don’t know than what they do know. After working in investment banks for 20 years many of which were as a Chief trader its second knowledge how to extract cash out of the market.
5 Forex News Events You Need To Know
In the fast moving world of currency markets where huge moves can seemingly come from nowhere, it is extremely important for new traders to learn about the various economic indicators and forex news events and releases that shape the markets. Indeed, quickly getting a handle on which data to look out for, what it means, and how to trade it can see new traders quickly become far more profitable and sets up the road to long term success.
Top 10 Chart Patterns Every Trader Should Know
Chart patterns are one of the most effective trading tools for a trader. They are pure price-action, and form on the basis of underlying buying and selling pressure. Chart patterns have a proven track-record, and traders use them to identify continuation or reversal signals, to open positions and identify price targets.
7 Ways to Avoid Forex Scams
The forex industry is recently seeing more and more scams. Here are 7 ways to avoid losing your money in such scams: Forex scams are becoming frequent. Michael Greenberg reports on luxurious expenses, including a submarine bought from the money taken from forex traders. Here’s another report of a forex fraud. So, how can we avoid falling in such forex scams?
What Are the 10 Fatal Mistakes Traders Make
Trading is exciting. Trading is hard. Trading is extremely hard. Some say that it takes more than 10,000 hours to master. Others believe that trading is the way to quick riches. They might be both wrong. What is important to know that no matter how experienced you are, mistakes will be part of the trading process.
The challenge: Timing the market and trader psychology
Successful trading often comes down to timing – entering and exiting trades at the right moments. Yet timing the market is notoriously difficult, largely because human psychology can derail even the best plans. Two powerful emotions in particular – fear and greed – tend to drive trading decisions off course.


