When looking for opportunities for option trades we need to locate situations where we can profit from at least one of the three option profit centers: underlying price movement, time decay, and implied volatility changes.
There are at least two ways we can approach this.
1. We can give priority to the price-movement dimension by first identifying an underlying asset (stock, ETF, index or futures contract) about whose price movement in the near future we have a strong opinion. That opinion can be that the stock is most likely to go up, down, sideways or explosively in an unknown direction. This identification is made in the same way that we would do it for a trade of the underlying itself, by scanning charts of a familiar list of candidates and/or by using computerized scanning aids.
With this step done, we now know what price behavior of the underlying we will set ourselves up to benefit from. That is, whether we will set up a trade that is bullish, bearish or neutral as to price.
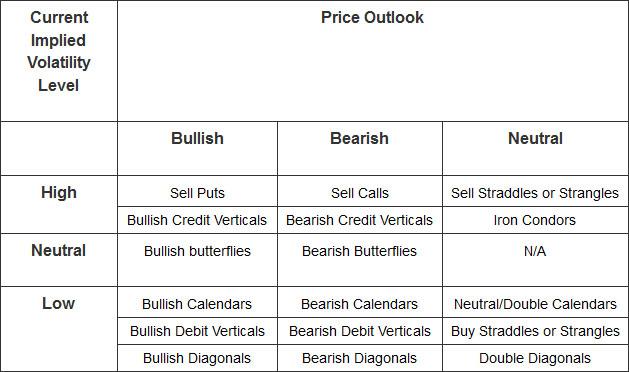
After identifying the underlying and its expected price direction in this way, our secondary task is to assess the asset’s implied volatility situation. Implied volatility measures whether the options are currently inflated, deflated or fairly priced for this particular asset. Once we know this, we can then determine what particular option strategy to use. If implied volatility is high (options are expensive and, therefore, most likely to deflate from here) we’ll choose a strategy that benefits from a drop in implied volatility – we will be net sellers of time value. Conversely, if implied volatility is low we will be net buyers of time value so that a re-inflation of the options we own will help us. Here are a selected few of the many strategies from which we could choose based on our two-dimensional assessment:
The implementation of strategies like these and others are covered in our Professional Options Trading course. The purpose of this article is just to discuss our selection process.
2. An alternative approach is to come at this the other way around – strategy first, then implied volatility and price behavior last. In this approach, we first determine what strategy we would like to use. All can work well in their proper price/volatility environments; but we may have specific ones that we favor out of personal preference. We also may be limited in our selection by the options approval level given to us by our broker. New traders or those with smaller brokerage accounts will have approval to trade fewer strategies.
In this strategy-first approach we pick our strategy first. Let’s say that we want to buy puts because we believe that in general the equity markets are against major highs and most likely to decline.
Looking at our table we see that buying puts is a bearish strategy (that’s why we picked it) that is best done when Implied Volatility is low.
So our first screening task is to scan for, or otherwise identify, underlying assets which are currently at volatility levels that are low (for them). We will now have a small list of candidates. From this list we then hone in on the ones that seem to be in the best situation for a near-term drop by examining their price charts. We can also use the scanning process to help with filtering in only stocks that have recently been moving strongly upward.
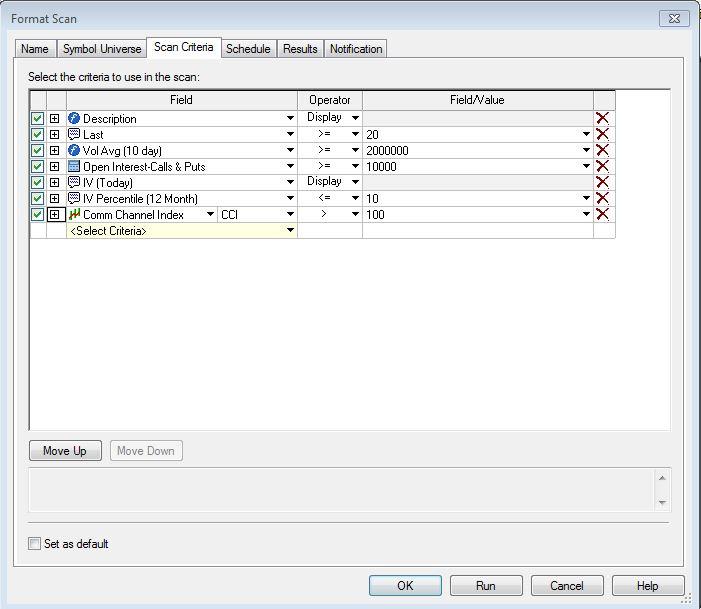
For this two-pronged scanning process, many trading platforms and some other third-party software vendors have good tools. The example shown below is from the TradeStation trading and analysis platform. This shows a scan for put buying candidates:
Here are the elements of this scan:
Description – display only. This tells us the name of the stock, rather than just its symbol.
Last Price >= 20. Filters out low-priced stocks whose movements tend to be more erratic.
Daily Volume Average (over 10 days) >= 2,000,000. Filters out thinly traded stocks.
Open Interest – Calls & Puts >=10,000. Filters out stocks with very little option activity.
Implied Volatility Today – display only. Shows current IV level.
IV Percentile (12 Month) <= 10. Returns only stocks whose current IV is in the bottom 10% of the range of their IV level over the past year. This is the guts of this scan – identifies low-IV stocks.
Commodity Channel Index > 100. This is a momentum scan which identifies stocks that have recently been moving far and fast to the upside. It is one of many indicators that could be used for this purpose. The idea is that this upward movement may have brought them into a good supply zone from where we can have confidence that they are most likely to drop. Whether in fact the stock is in a good supply zone can only be determined by proper chart analysis, which is our next step.
A scan like this will narrow down the universe of stocks to a manageable number. On this date it returned a list of eleven stocks. It was then quick work to review these few charts and identify the two or three that looked like legitimate put-buying candidates.
In summary, each options strategy works best in its appropriate price/volatility environment. We need to match the specific situation to the best strategy. We can do this by approaching it from the price standpoint first, with volatility secondary; or from the volatility side first, and then check for good price situations. Either way is valid, although the volatility-first scan will generally be quicker overall because the labor-intensive task of analyzing charts will be done on fewer candidates.
This content is intended to provide educational information only. This information should not be construed as individual or customized legal, tax, financial or investment services. As each individual's situation is unique, a qualified professional should be consulted before making legal, tax, financial and investment decisions. The educational information provided in this article does not comprise any course or a part of any course that may be used as an educational credit for any certification purpose and will not prepare any User to be accredited for any licenses in any industry and will not prepare any User to get a job. Reproduced by permission from OTAcademy.com click here for Terms of Use: https://www.otacademy.com/about/terms
Editors’ Picks

EUR/USD: US Dollar to remain pressured until uncertainty fog dissipates Premium
The EUR/USD pair lost additional ground in the first week of February, settling at around 1.1820. The reversal lost momentum after the pair peaked at 1.2082 in January, its highest since mid-2021.

Gold: Volatility persists in commodity space Premium
After losing more than 8% to end the previous week, Gold (XAU/USD) remained under heavy selling pressure on Monday and dropped toward $4,400. Although XAU/USD staged a decisive rebound afterward, it failed to stabilize above $5,000.

GBP/USD: Pound Sterling tests key support ahead of a big week Premium
The Pound Sterling (GBP) changed course against the US Dollar (USD), with GBP/USD giving up nearly 200 pips in a dramatic correction.

Bitcoin: The worst may be behind us
Bitcoin (BTC) price recovers slightly, trading at $65,000 at the time of writing on Friday, after reaching a low of $60,000 during the early Asian trading session. The Crypto King remained under pressure so far this week, posting three consecutive weeks of losses exceeding 30%.

Three scenarios for Japanese Yen ahead of snap election Premium
The latest polls point to a dominant win for the ruling bloc at the upcoming Japanese snap election. The larger Sanae Takaichi’s mandate, the more investors fear faster implementation of tax cuts and spending plans.
RECOMMENDED LESSONS
Making money in forex is easy if you know how the bankers trade!
I’m often mystified in my educational forex articles why so many traders struggle to make consistent money out of forex trading. The answer has more to do with what they don’t know than what they do know. After working in investment banks for 20 years many of which were as a Chief trader its second knowledge how to extract cash out of the market.
5 Forex News Events You Need To Know
In the fast moving world of currency markets where huge moves can seemingly come from nowhere, it is extremely important for new traders to learn about the various economic indicators and forex news events and releases that shape the markets. Indeed, quickly getting a handle on which data to look out for, what it means, and how to trade it can see new traders quickly become far more profitable and sets up the road to long term success.
Top 10 Chart Patterns Every Trader Should Know
Chart patterns are one of the most effective trading tools for a trader. They are pure price-action, and form on the basis of underlying buying and selling pressure. Chart patterns have a proven track-record, and traders use them to identify continuation or reversal signals, to open positions and identify price targets.
7 Ways to Avoid Forex Scams
The forex industry is recently seeing more and more scams. Here are 7 ways to avoid losing your money in such scams: Forex scams are becoming frequent. Michael Greenberg reports on luxurious expenses, including a submarine bought from the money taken from forex traders. Here’s another report of a forex fraud. So, how can we avoid falling in such forex scams?
What Are the 10 Fatal Mistakes Traders Make
Trading is exciting. Trading is hard. Trading is extremely hard. Some say that it takes more than 10,000 hours to master. Others believe that trading is the way to quick riches. They might be both wrong. What is important to know that no matter how experienced you are, mistakes will be part of the trading process.
The challenge: Timing the market and trader psychology
Successful trading often comes down to timing – entering and exiting trades at the right moments. Yet timing the market is notoriously difficult, largely because human psychology can derail even the best plans. Two powerful emotions in particular – fear and greed – tend to drive trading decisions off course.


