![]() Sam Seiden
Sam Seiden
Independent Analyst
The key to low risk consistent profits in trading and investing is knowing where the next turn and move in a market is going to be, before it happens. Those who can do this with a very high degree of accuracy own a skill set that allows them to attain low risk profits in any market and any time frame. So, how can we predict where the next big move in a market is going to begin? The answer is not that difficult if you use simple logic. Every turn in a market happens because of a supply and demand imbalance at a specific price level. The greater the imbalance, the stronger the turn in price. So, to find the next big turn in price and market move, we must figure out where the greatest supply and demand imbalances are in the market. If you agree with this, then there is one question left... What does the picture of a supply and demand imbalance look like on a price chart?
You see, this is where most people stumble. They don't go down the simple logic path we just went through. Instead, they buy a trading book that teaches them conventional Technical Analysis which is a very flawed school of thought. Or, they dive into the world of conventional Fundamental Analysis which has you buying when the news is good (at a high price) and selling when the news is bad (at a low price) which is a disaster for you, but a gift for those on the other side of your trades and investments. Let's get back to a proven path to profits which is the simple logic behind how you make money buying and selling anything which is buying low (at demand or wholesale) and selling high (at supply or retail). To find these low risk turning points at price levels where supply and demand are out of balance, we must know precisely what the picture of an imbalance looks like on a chart. I have written about this many times before in prior articles, but after writing about this for years, I still receive one common question which is: "I understand why you chose the supply or demand level in your chart, but why did you ignore the others?" Knowing the difference between a real demand or supply level and one that is not is the most important part of the trading puzzle. To us at Online Trading Academy, we have a simple, yet very specific set of criteria that helps us determine a quality demand or supply level vs one that is not. We call this set of criteria "Odds Enhancers." In the articles I write, I typically go over two of them on a regular basis. In the Professional Trader class, we go over four "Odds Enhancers." In the Extended Learning Track (XLT) class, we go over the remaining four and that completes the list. The Odds Enhancers have one purpose: To train your eye to identify a key demand or supply level (market turning point) and train your eye to know the difference between a key level and one that is not a level at all.
Let's take a look at an XLT trade from last week that illustrates what I am talking about. The chart below is a five minute chart of the S&P. In the early morning, price began to decline. When I looked to the left, I saw what would appear to many people to be many demand levels on top of each other (circled areas on chart). Many people would look at those circled areas and call them demand (support) levels and likely buy when price revisited them on the decline. This depends on your definition of demand (support). To us, those are not demand levels; they don't meet the criteria for a quality demand level based on our "Odds Enhancers." Therefore, I would not even call them demand. However, the level at the bottom had enough "Odds Enhancers" to qualify it as strong demand. Which Odds Enhancers and why are beyond the scope of this article. And, when I go too deep into Odds Enhancers in articles, XLT members send angry emails as they feel I may be giving away their edge which I certainly understand and respect that.
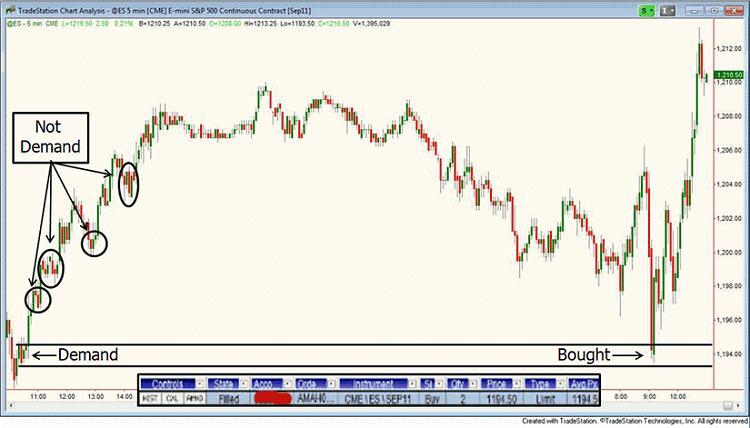
If you can clearly see the difference between the demand level I bought at vs the other areas I have circled, you're doing very well and have an edge needed to succeed in this ever competitive game of trading. If you don't, be careful putting your hard-earned money at risk in the markets. Below are some Odds Enhancers to consider that helped qualify the demand level in the chart for your review and benefit.
Some Odds Enhancers:
1. How did price leave the level.
2. Time at the level.
3. Levels on top of level.
4. Retracements.
Remember, every turn in a market and every strong move in a market happens and originates at a price level where demand and supply are out-of-balance. We must start with that premise and then clearly understand what that picture looks like on a price chart. Knowing how to identify a quality turning point (demand or supply level) is just as important as knowing what is not quality; this is where many people get confused. They can spot the good ones but don't know which to ignore and that's a problem solved by Odds Enhancers. Odds Enhancers are a simple deeper dive into the real supply and demand equation at a given price level.
Note: All information on this page is subject to change. The use of this website constitutes acceptance of our user agreement. Please read our privacy policy and legal disclaimer. Opinions expressed at FXstreet.com are those of the individual authors and do not necessarily represent the opinion of FXstreet.com or its management. Risk Disclosure: Trading foreign exchange on margin carries a high level of risk, and may not be suitable for all investors. The high degree of leverage can work against you as well as for you. Before deciding to invest in foreign exchange you should carefully consider your investment objectives, level of experience, and risk appetite. The possibility exists that you could sustain a loss of some or all of your initial investment and therefore you should not invest money that you cannot afford to lose. You should be aware of all the risks associated with foreign exchange trading, and seek advice from an independent financial advisor if you have any doubts.
Editors’ Picks

EUR/USD hits two-day highs near 1.1820
EUR/USD picks up pace and reaches two-day tops around 1.1820 at the end of the week. The pair’s move higher comes on the back of renewed weakness in the US Dollar amid growing talk that the Fed could deliver an interest rate cut as early as March. On the docket, the flash US Consumer Sentiment improves to 57.3 in February.

GBP/USD reclaims 1.3600 and above
GBP/USD reverses two straight days of losses, surpassing the key 1.3600 yardstick on Friday. Cable’s rebound comes as the Greenback slips away from two-week highs in response to some profit-taking mood and speculation of Fed rate cuts. In addition, hawkish comments from the BoE’s Pill are also collaborating with the quid’s improvement.

USD/JPY drops back below 157.00, as focus shifts to Japan snap election
USD/JPY is back in the red below 157.00 in the Asian session on Friday. The Japanese Yen recovers ground against the US Dollar amid some profit-taking ahead of Japan's snap general election on Sunday. The preliminary reading of the Michigan Consumer Sentiment Index report for February will be released later on Friday.
Editors’ Picks

EUR/USD: US Dollar to remain pressured until uncertainty fog dissipates Premium
The EUR/USD pair lost additional ground in the first week of February, settling at around 1.1820. The reversal lost momentum after the pair peaked at 1.2082 in January, its highest since mid-2021.

Gold: Volatility persists in commodity space Premium
After losing more than 8% to end the previous week, Gold (XAU/USD) remained under heavy selling pressure on Monday and dropped toward $4,400. Although XAU/USD staged a decisive rebound afterward, it failed to stabilize above $5,000.

GBP/USD: Pound Sterling tests key support ahead of a big week Premium
The Pound Sterling (GBP) changed course against the US Dollar (USD), with GBP/USD giving up nearly 200 pips in a dramatic correction.

Bitcoin: The worst may be behind us
Bitcoin (BTC) price recovers slightly, trading at $65,000 at the time of writing on Friday, after reaching a low of $60,000 during the early Asian trading session. The Crypto King remained under pressure so far this week, posting three consecutive weeks of losses exceeding 30%.

Three scenarios for Japanese Yen ahead of snap election Premium
The latest polls point to a dominant win for the ruling bloc at the upcoming Japanese snap election. The larger Sanae Takaichi’s mandate, the more investors fear faster implementation of tax cuts and spending plans.
RECOMMENDED LESSONS
Making money in forex is easy if you know how the bankers trade!
I’m often mystified in my educational forex articles why so many traders struggle to make consistent money out of forex trading. The answer has more to do with what they don’t know than what they do know. After working in investment banks for 20 years many of which were as a Chief trader its second knowledge how to extract cash out of the market.
5 Forex News Events You Need To Know
In the fast moving world of currency markets where huge moves can seemingly come from nowhere, it is extremely important for new traders to learn about the various economic indicators and forex news events and releases that shape the markets. Indeed, quickly getting a handle on which data to look out for, what it means, and how to trade it can see new traders quickly become far more profitable and sets up the road to long term success.
Top 10 Chart Patterns Every Trader Should Know
Chart patterns are one of the most effective trading tools for a trader. They are pure price-action, and form on the basis of underlying buying and selling pressure. Chart patterns have a proven track-record, and traders use them to identify continuation or reversal signals, to open positions and identify price targets.
7 Ways to Avoid Forex Scams
The forex industry is recently seeing more and more scams. Here are 7 ways to avoid losing your money in such scams: Forex scams are becoming frequent. Michael Greenberg reports on luxurious expenses, including a submarine bought from the money taken from forex traders. Here’s another report of a forex fraud. So, how can we avoid falling in such forex scams?
What Are the 10 Fatal Mistakes Traders Make
Trading is exciting. Trading is hard. Trading is extremely hard. Some say that it takes more than 10,000 hours to master. Others believe that trading is the way to quick riches. They might be both wrong. What is important to know that no matter how experienced you are, mistakes will be part of the trading process.
The challenge: Timing the market and trader psychology
Successful trading often comes down to timing – entering and exiting trades at the right moments. Yet timing the market is notoriously difficult, largely because human psychology can derail even the best plans. Two powerful emotions in particular – fear and greed – tend to drive trading decisions off course.