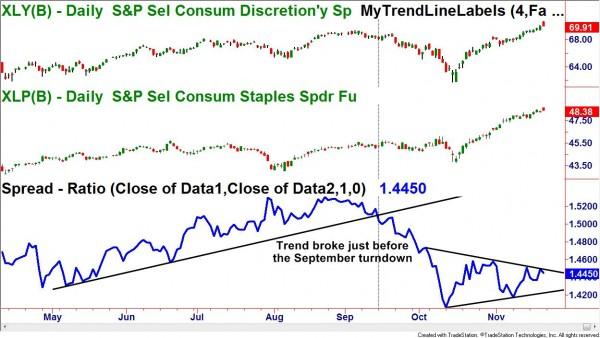
In a recent Extended Learning Track course, I was fielding questions from nervous traders and investors about where the potential market top could be. While I do not know the exact high we will make before the next correction or bear market occurs, I do know of several techniques that we can use to identify when the market environment is right for such a turn to happen.
When the economy and markets show weakness, the majority of people worldwide focus on saving money and spending wisely. Especially those hit by unemployment or a reduction in their credit lines. Could we use this natural tendency of swinging between penny-pinching and reckless spending to help predict the movements of the markets? Of course, we can!
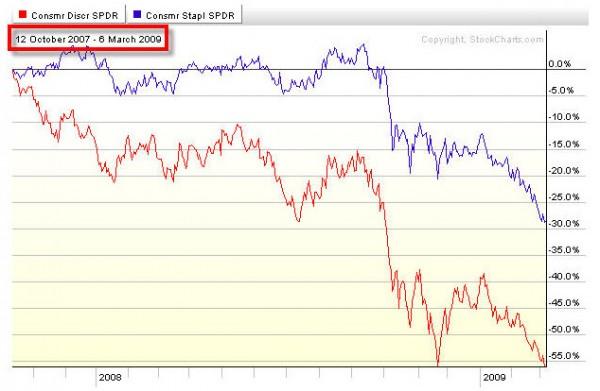
According to Investopedia, the Consumer Discretionary Sector is, “A sector of the economy that consists of businesses that sell nonessential goods and services. Companies in this sector include retailers, media companies, consumer services companies, consumer durables and apparel companies, and automobiles and components companies.” They define Consumer Staples as, “The industries that manufacture and sell food/beverages, tobacco, prescription drugs and household products.” Therefore, during times of economic bust, one would expect the discretionary companies to underperform staples as investors would not buy companies facing slow or no growth.
You can see how this looked during the 2007-2008 market collapse.
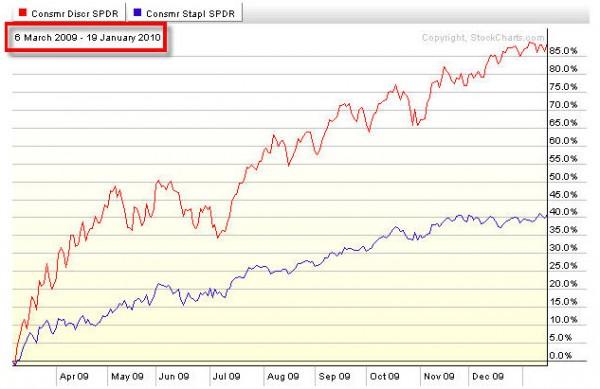
Of course, as the markets turn positive, you would expect the opposite.
As a technical analyst, there is a way to use this relationship and identify potential turning points in the market. TradeStation Securities has a useful technical indicator I like to use called the Spread Ratio. This tool allows the trader to see a visual representation of the price of one security divided by another. By using trend lines, a trader can observe changes in the performance of two securities and make decisions about the broad markets.
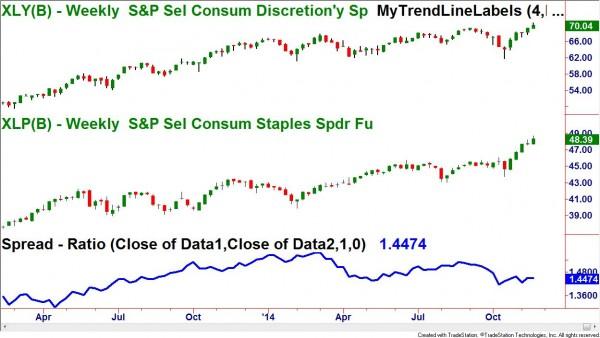
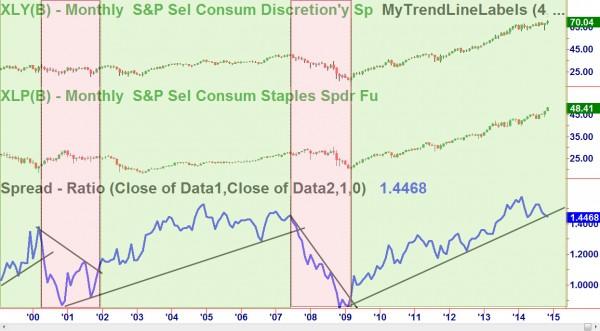
To see changes in the overall market, I use a spread ratio that divides the closing price of the XLY, the consumer discretionary ETF, by the closing price of the XLP, the consumer staples ETF. If the ratio line is rising, the discretionary are outperforming the staples and we are in a bullish trend. Should the trend break and the ratio line decline, we are experiencing a bearish move and trend in the markets. Supply and demand work the same on the ratio as they would on a stock.
Notice the monthly charts of the XLY and XLP with the spread ratio. The breaks in trend correctly identified the shifts from bullish to bearish markets. Although this technique will not give you exact tops and bottoms, it will alert you to major changes in the markets.
The larger time frames on charts show us the major trends and we can adjust our biases accordingly. However, as traders, we often want to look at shorter time frames to see smaller tradable trends. This ratio analysis will also help with that. Simply adjust the chart’s time frame to your needs but keep in mind that the larger time frame trends always dominate over the shorter.
We are currently seeing the daily trend consolidating. We have had higher lows and therefore some buying in the discretionary but it is not what we should see in a healthy bull market.
By looking at the rotation between staples and discretionary sectors, traders can gain additional insight as to the future direction of the markets. Until next time, honor your stops, trade safe and trade well!
Neither Freedom Management Partners nor any of its personnel are registered broker-dealers or investment advisers. I will mention that I consider certain securities or positions to be good candidates for the types of strategies we are discussing or illustrating. Because I consider the securities or positions appropriate to the discussion or for illustration purposes does not mean that I am telling you to trade the strategies or securities. Keep in mind that we are not providing you with recommendations or personalized advice about your trading activities. The information we are providing is not tailored to any individual. Any mention of a particular security is not a recommendation to buy, sell, or hold that or any other security or a suggestion that it is suitable for any specific person. Keep in mind that all trading involves a risk of loss, and this will always be the situation, regardless of whether we are discussing strategies that are intended to limit risk. Also, Freedom Management Partners’ personnel are not subject to trading restrictions. I and others at Freedom Management Partners could have a position in a security or initiate a position in a security at any time.
Editors’ Picks

USD/JPY drops back below 157.00 on Japan's verbal intervention
USD/JPY has come under moderate selling pressure below 157.00 in the Asian session on Monday. The Japanese Yen lost ground to near 157.70 following Japan’s ruling Liberal Democratic Party's outright majority win in Sunday’s lower house election, opening the door to more fiscal stimulus by Prime Minister Sanae Takaichi. However, JPY buyers jumped back and dragged the pair southward on FX verbal intervention by Japan’s Finance Minister Katayama.

Gold eyes acceptance above $5,000, kicking off a big week
Gold is consolidating the latest uptick at around the $5,000 mark, with buyers gathering pace for a sustained uptrend as a critical week kicks off. All eyes remain on the delayed Nonfarm Payrolls and Consumer Price Index data from the United States due on Wednesday and Friday, respectively.

AUD/USD: Buyers eyes 0.7050 amid upbeat mood
AUD/USD builds on Friday's goodish rebound from sub-0.6900 levels and kicks off the new week on a positive note, with bulls awaiting a sustained move and acceptance above mid-0.7000s before placing fresh bets. The widening RBA-Fed divergence, along with the upbeat market mood, acts as a tailwind for the risk-sensitive Aussie amid some follow-through US Dollar selling for the second straight day.

Top Crypto Gainers: Aster, Decred, and Kaspa rise as selling pressure wanes
Altcoins such as Aster, Decred, and Kaspa are leading the broader cryptocurrency market recovery over the last 24 hours, as Bitcoin holds above $70,000 on Monday, up from the $60,000 dip on Thursday.

Weekly column: Saturn-Neptune and the end of the Dollar’s 15-year bull cycle
Tariffs are not only inflationary for a nation but also risk undermining the trust and credibility that go hand in hand with the responsibility of being the leading nation in the free world and controlling the world’s reserve currency.
RECOMMENDED LESSONS
Making money in forex is easy if you know how the bankers trade!
I’m often mystified in my educational forex articles why so many traders struggle to make consistent money out of forex trading. The answer has more to do with what they don’t know than what they do know. After working in investment banks for 20 years many of which were as a Chief trader its second knowledge how to extract cash out of the market.
5 Forex News Events You Need To Know
In the fast moving world of currency markets where huge moves can seemingly come from nowhere, it is extremely important for new traders to learn about the various economic indicators and forex news events and releases that shape the markets. Indeed, quickly getting a handle on which data to look out for, what it means, and how to trade it can see new traders quickly become far more profitable and sets up the road to long term success.
Top 10 Chart Patterns Every Trader Should Know
Chart patterns are one of the most effective trading tools for a trader. They are pure price-action, and form on the basis of underlying buying and selling pressure. Chart patterns have a proven track-record, and traders use them to identify continuation or reversal signals, to open positions and identify price targets.
7 Ways to Avoid Forex Scams
The forex industry is recently seeing more and more scams. Here are 7 ways to avoid losing your money in such scams: Forex scams are becoming frequent. Michael Greenberg reports on luxurious expenses, including a submarine bought from the money taken from forex traders. Here’s another report of a forex fraud. So, how can we avoid falling in such forex scams?
What Are the 10 Fatal Mistakes Traders Make
Trading is exciting. Trading is hard. Trading is extremely hard. Some say that it takes more than 10,000 hours to master. Others believe that trading is the way to quick riches. They might be both wrong. What is important to know that no matter how experienced you are, mistakes will be part of the trading process.
The challenge: Timing the market and trader psychology
Successful trading often comes down to timing – entering and exiting trades at the right moments. Yet timing the market is notoriously difficult, largely because human psychology can derail even the best plans. Two powerful emotions in particular – fear and greed – tend to drive trading decisions off course.
