The Ichimoku Cloud is a technical analysis tool designed to provide traders with a rapid, comprehensive view of market trends, momentum, and future support and resistance levels. Developed in Japan in the 1930s, the indicator provides a structured framework that helps traders determine whether markets are trending, ranging, overextended, or trading at fair value — all from a single chart.

The origins and purpose of the Ichimoku Cloud

Ichimoku was developed by Goichi Hosoda in Japan during the 1930s. The term “Ichimoku” translates roughly to “one-look equilibrium chart,” reflecting the indicator’s goal of summarizing market conditions instantly.

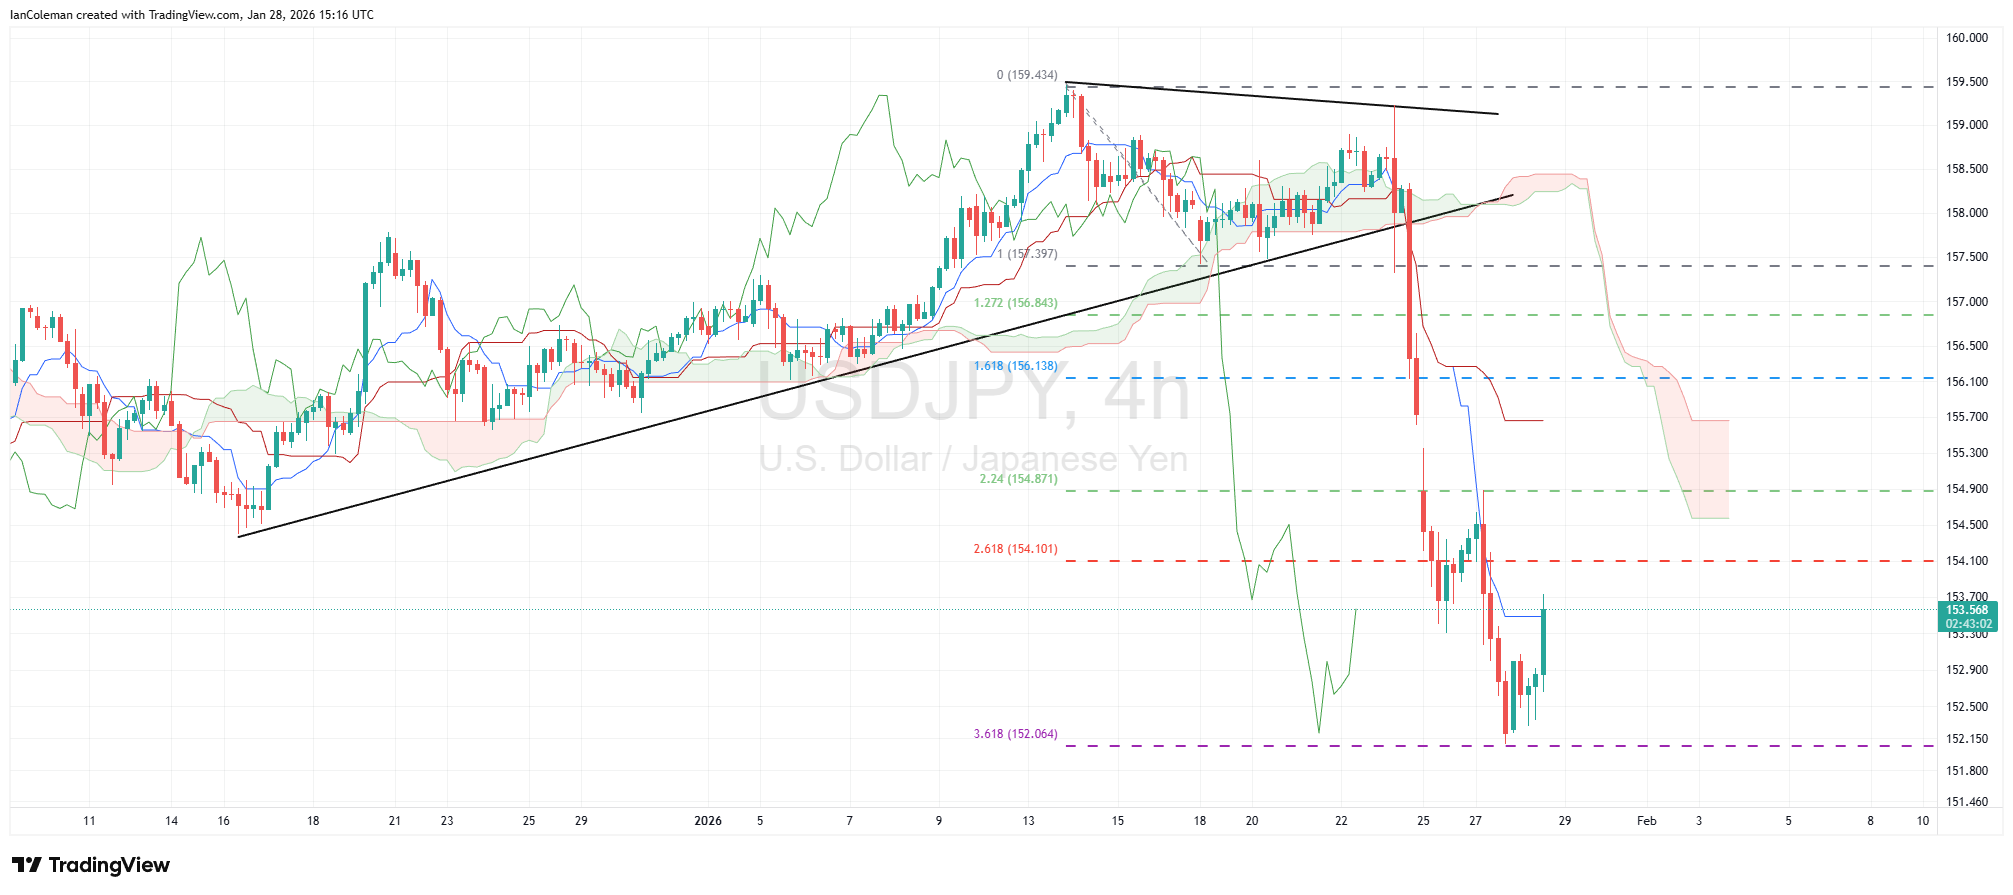
At first glance, the Ichimoku Cloud can appear complex, especially when viewed alongside additional tools such as trend lines or Fibonacci retracements. This visual density often leads traders to dismiss it as overly complicated. However, this complexity becomes manageable once the purpose of each component is clearly understood.

The Ichimoku Cloud was designed to function as a complete analytical system rather than a single signal-based indicator.

What the Ichimoku Cloud is – and what it is not

The Ichimoku Cloud is a trend-following system, a market structure framework, a probability filter, and a trade management tool. A unique feature of the indicator is its ability to project future support and resistance levels.

However, the Ichimoku Cloud is not designed to identify market reversals, nor is it intended for short-term scalping strategies. Traders who struggle with Ichimoku often attempt to force it to perform tasks it was never designed to do.

The system was built to analyze medium-term market movements. The 26-period setting reflects the average number of working days in a Japanese trading month at the time of its creation. While the indicator can be adapted down to the four-hour timeframe, using it on lower timeframes significantly reduces the effectiveness of the cloud’s structure.

Setting up the Ichimoku Cloud on a chart

The Ichimoku Cloud is available on most major charting platforms. On TradingView, it can be accessed directly through the indicators menu by searching for “Ichimoku.”

Ichimoku Cloud chart overlay

While the calculations behind the indicator’s components are important, the immediate focus is on understanding how the cloud behaves visually and how it frames market structure.

What the Ichimoku Cloud shows at a glance

The Ichimoku Cloud is designed to quickly reveal several key aspects of market behavior:

  • Whether the market is trending or ranging
  • Whether buyers or sellers are in control
  • Whether the price is overextended or trading near fair value

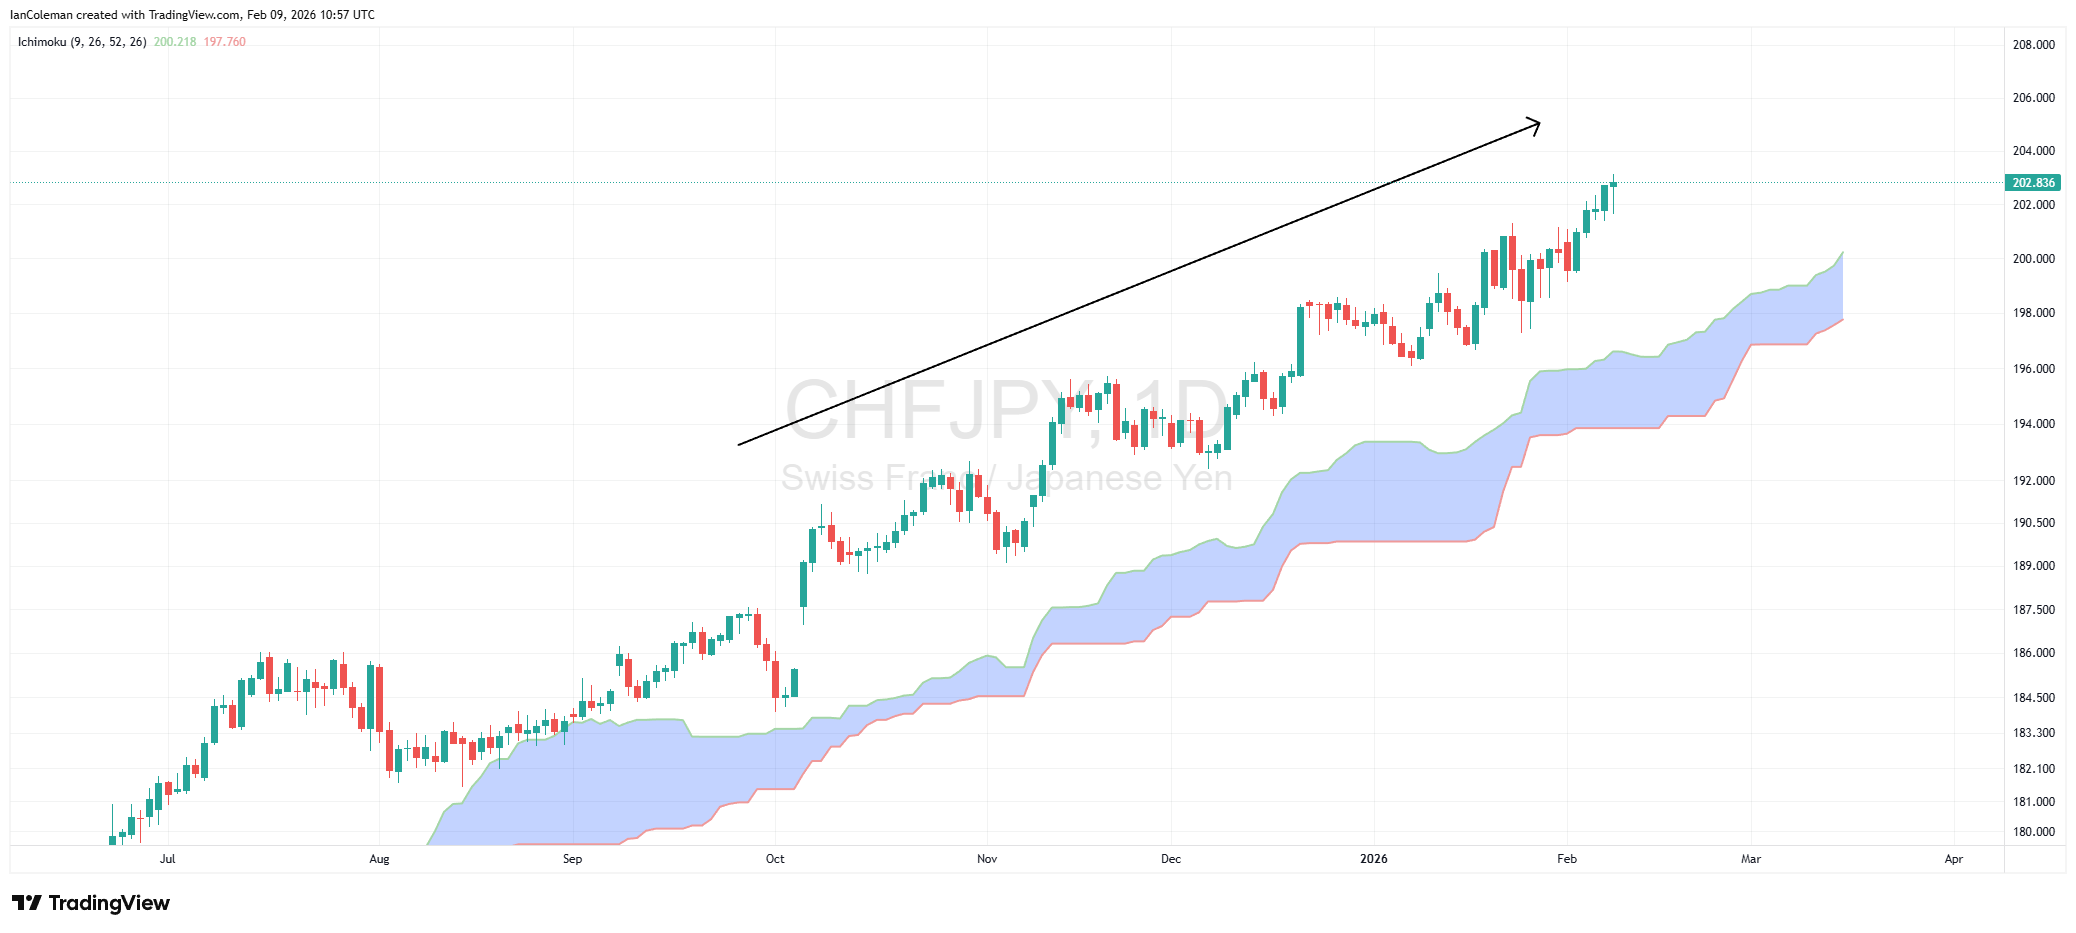
When price trades above a thick cloud base, the market is considered to be trending higher.

Ichimoku bullish chart
Price above the cloud – Bullish

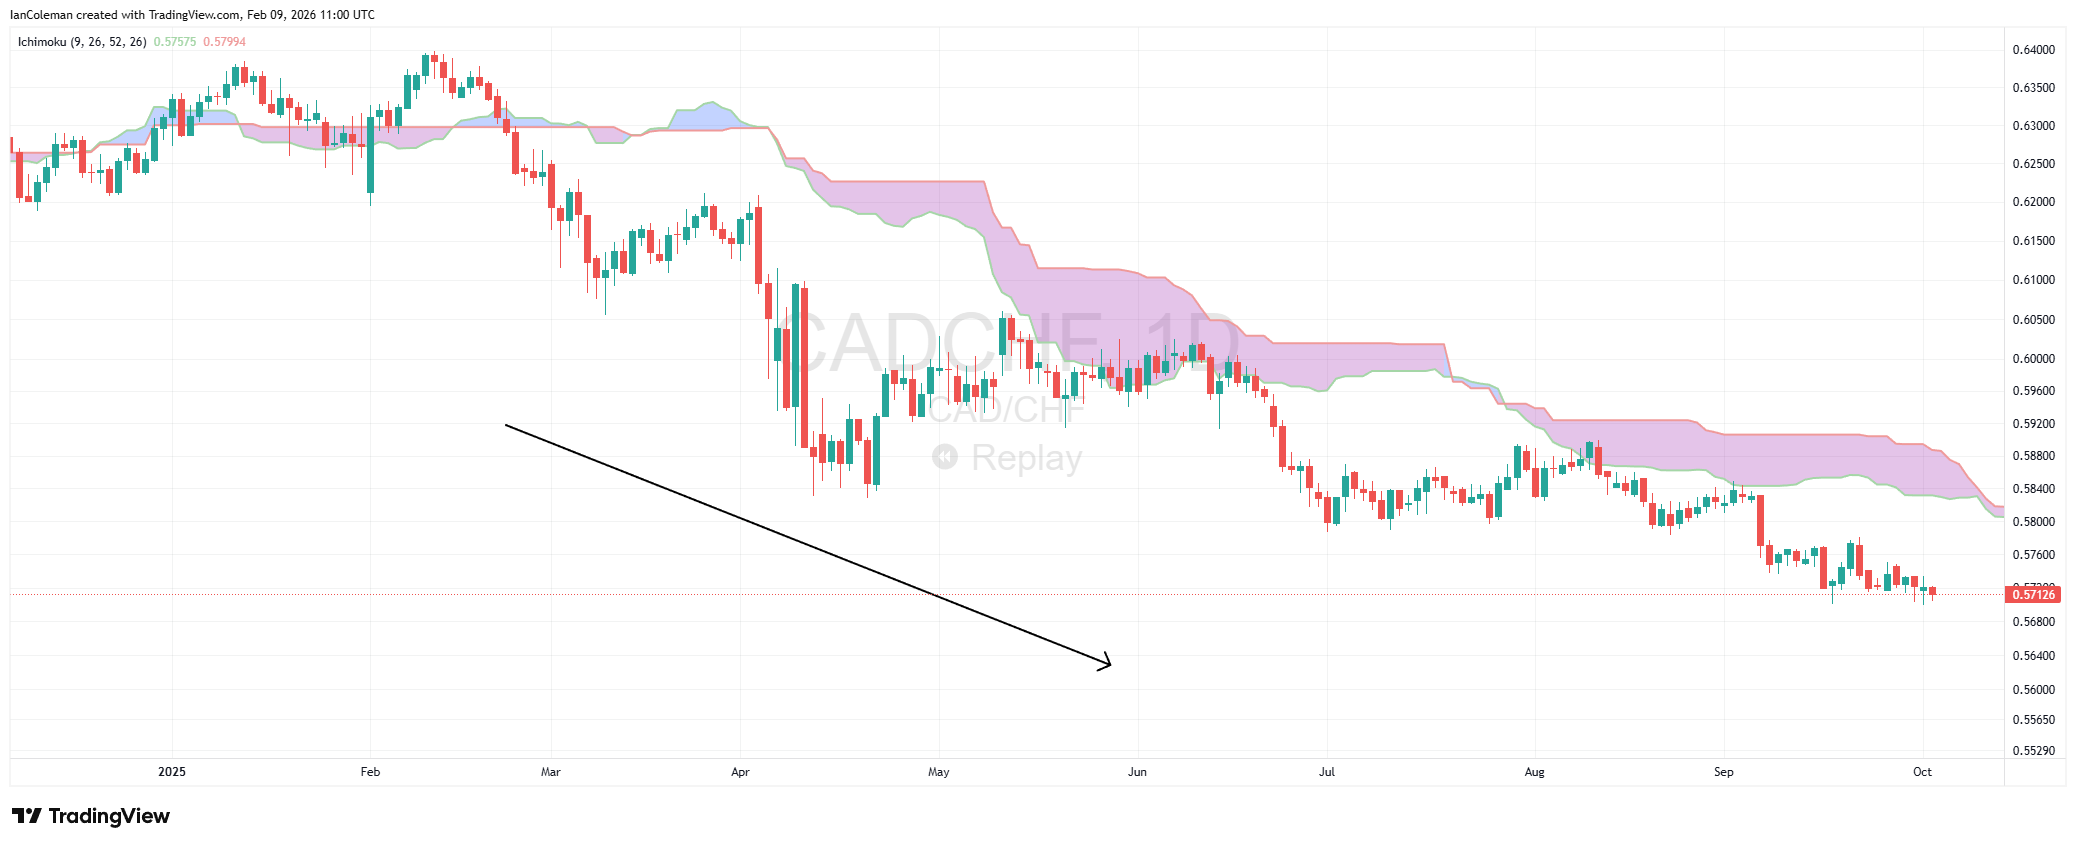
When price trades below a thick cloud cover, the market is considered to be trending lower.

Price below the Ichimoku Cloud – Bearish

If price pullbacks are being bought near the cloud, buyers remain in control.

Ichimoku Cloud bullish entries

If rallies are sold near the cloud, sellers remain in control.

Ichimoku Cloud bearish entries


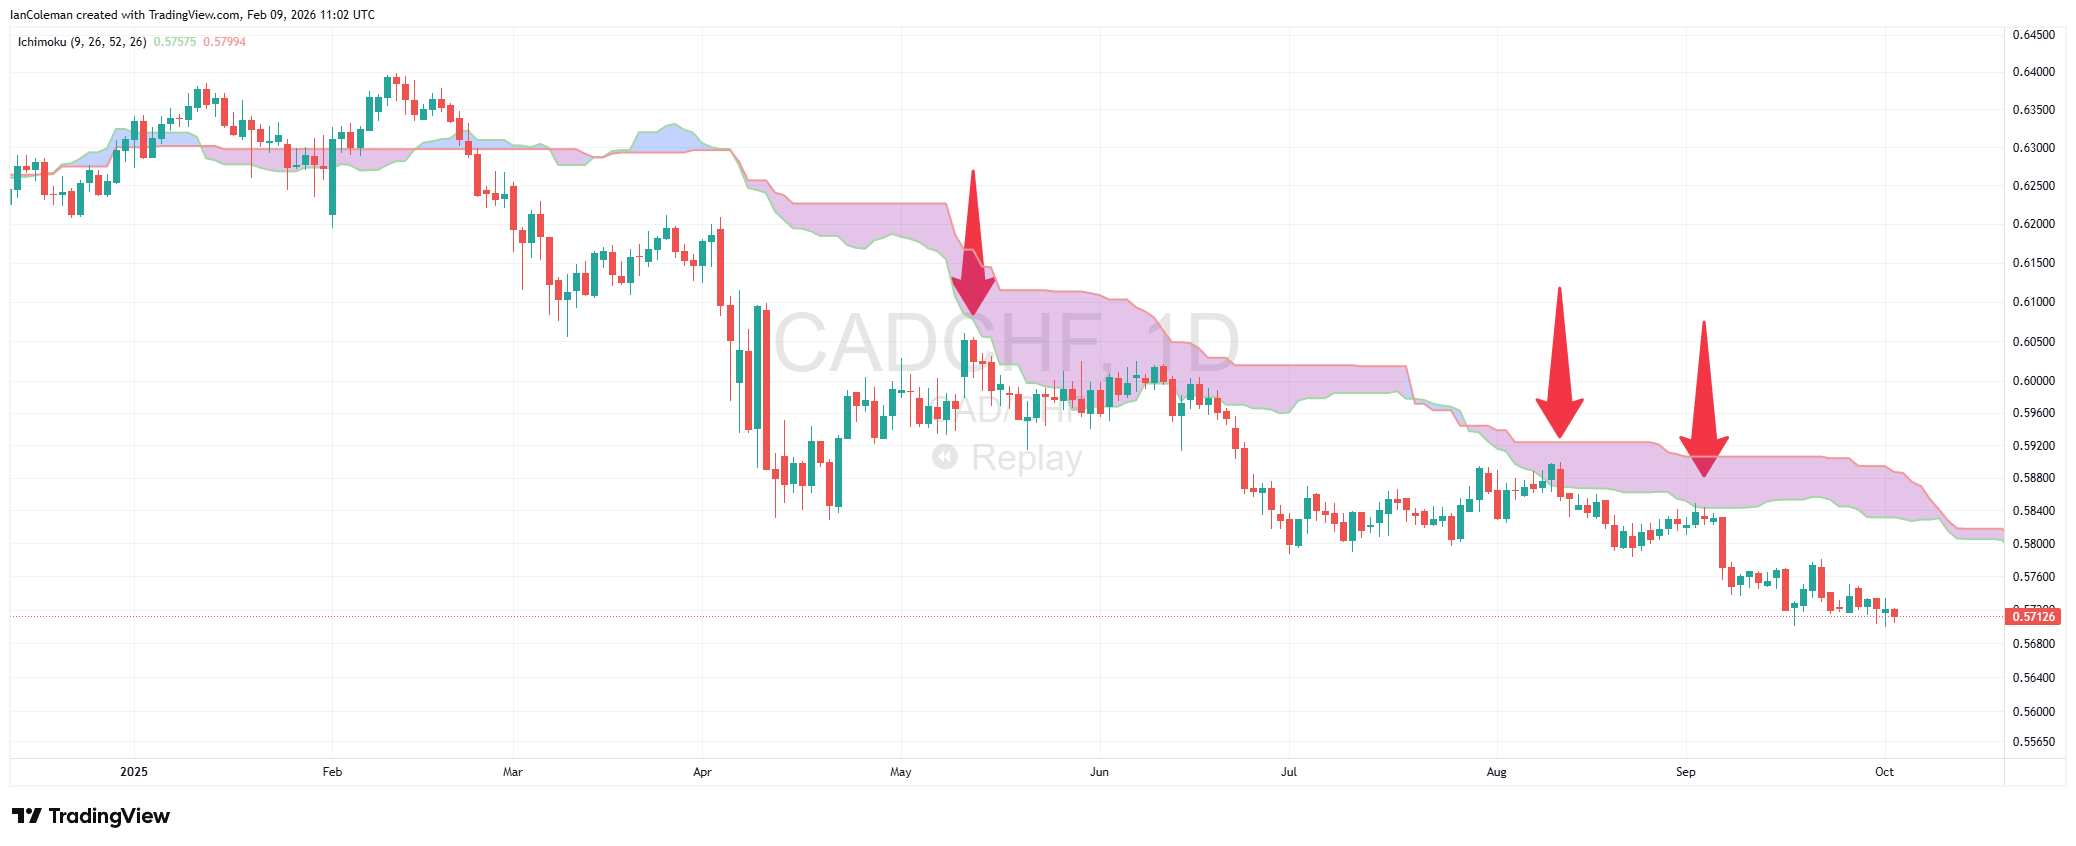
A strong move away from the cloud highlights that price is overextended, creating room for the cloud to catch up.

Price rallying away from the Ichimoku Cloud
Price rallying away from the Ichimoku Cloud, room for correction


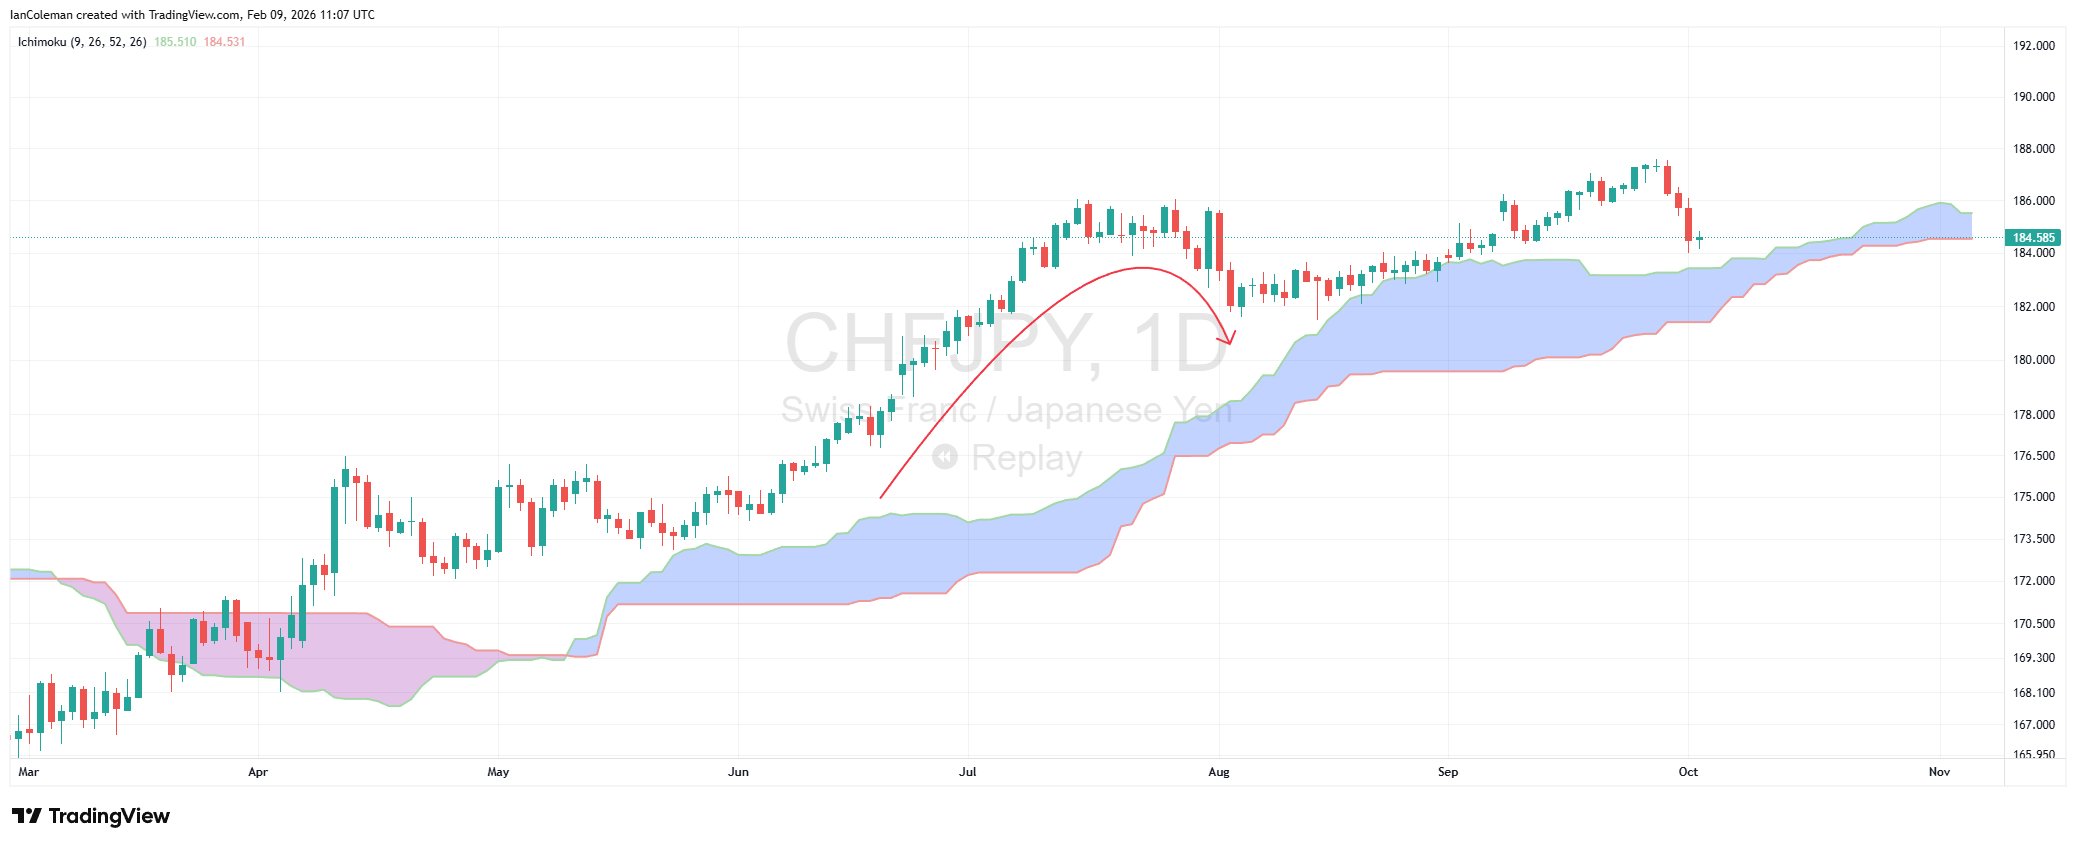
When price trades within the cloud, the market is considered trading at fair value.

Price trading inside the Ichimoku Cloud – Fair value


Understanding the Kumo: The cloud structure

The cloud, also known as the Kumo, is formed by two boundaries: Senkou Span A and Senkou Span B. These levels are derived from calculations involving the Tenkan and Kijun lines.

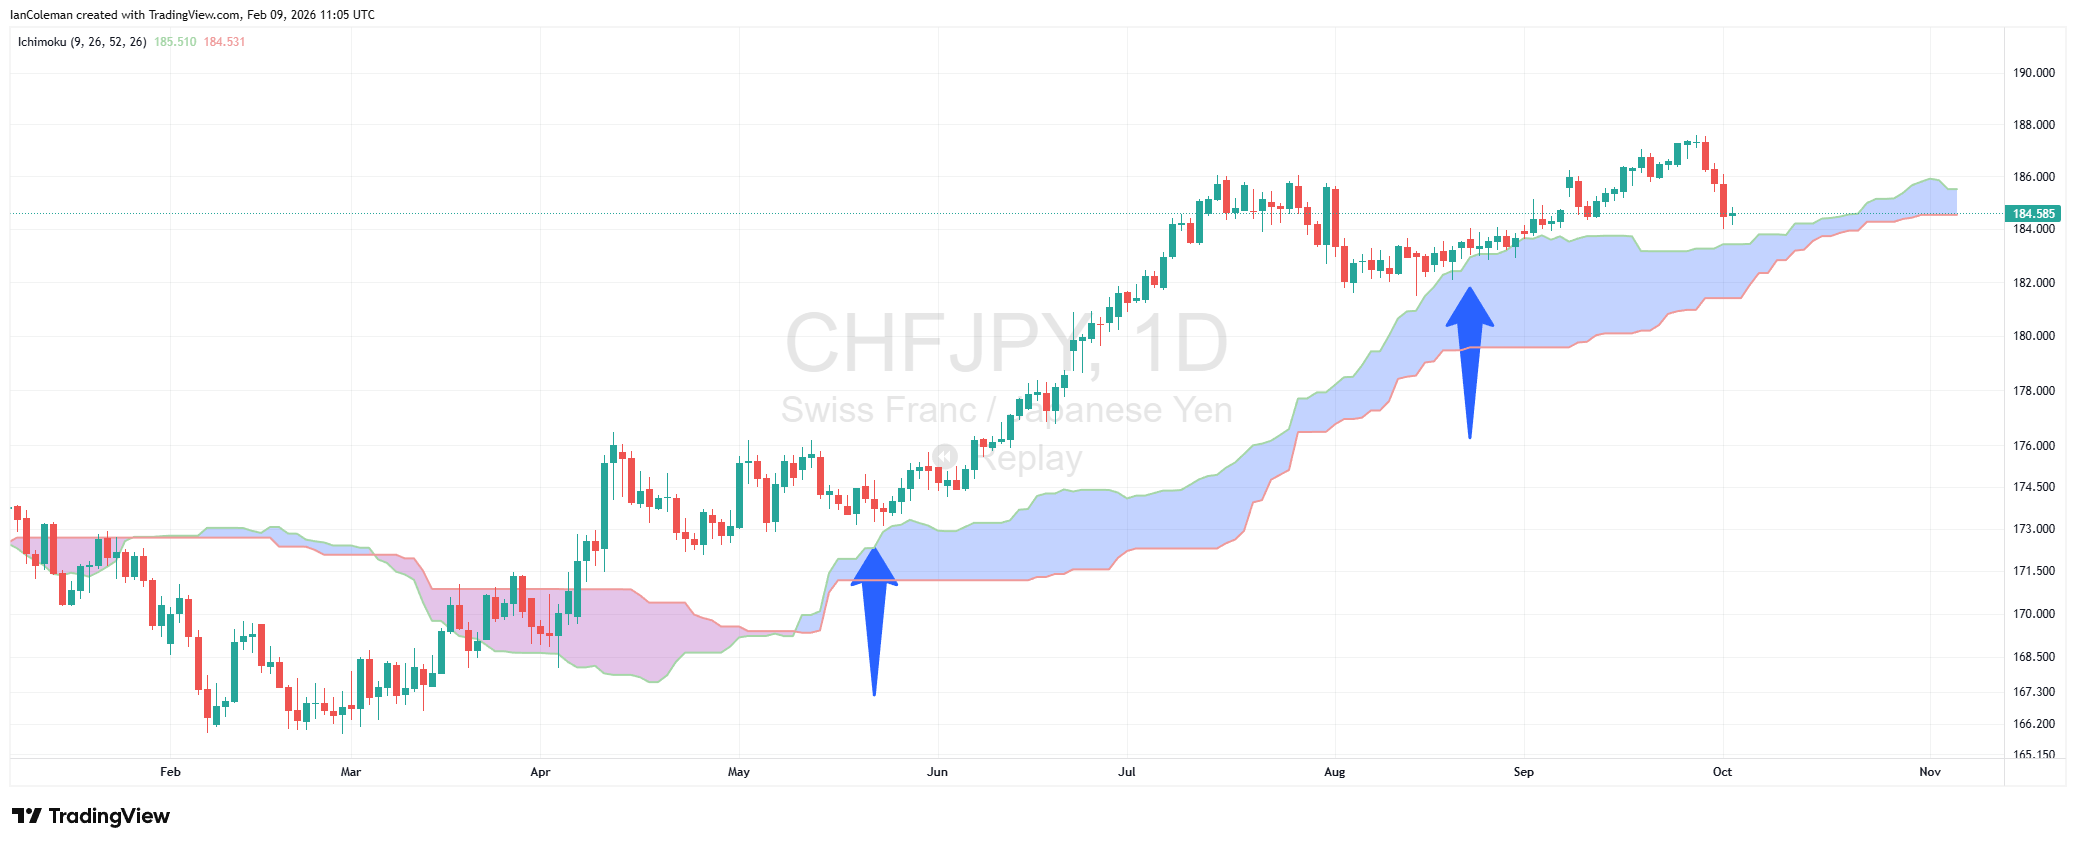
A bullish cloud forms when Senkou Span A is above Senkou Span B, typically displayed as a blue cloud.

Span A above Span B – Bullish cloud

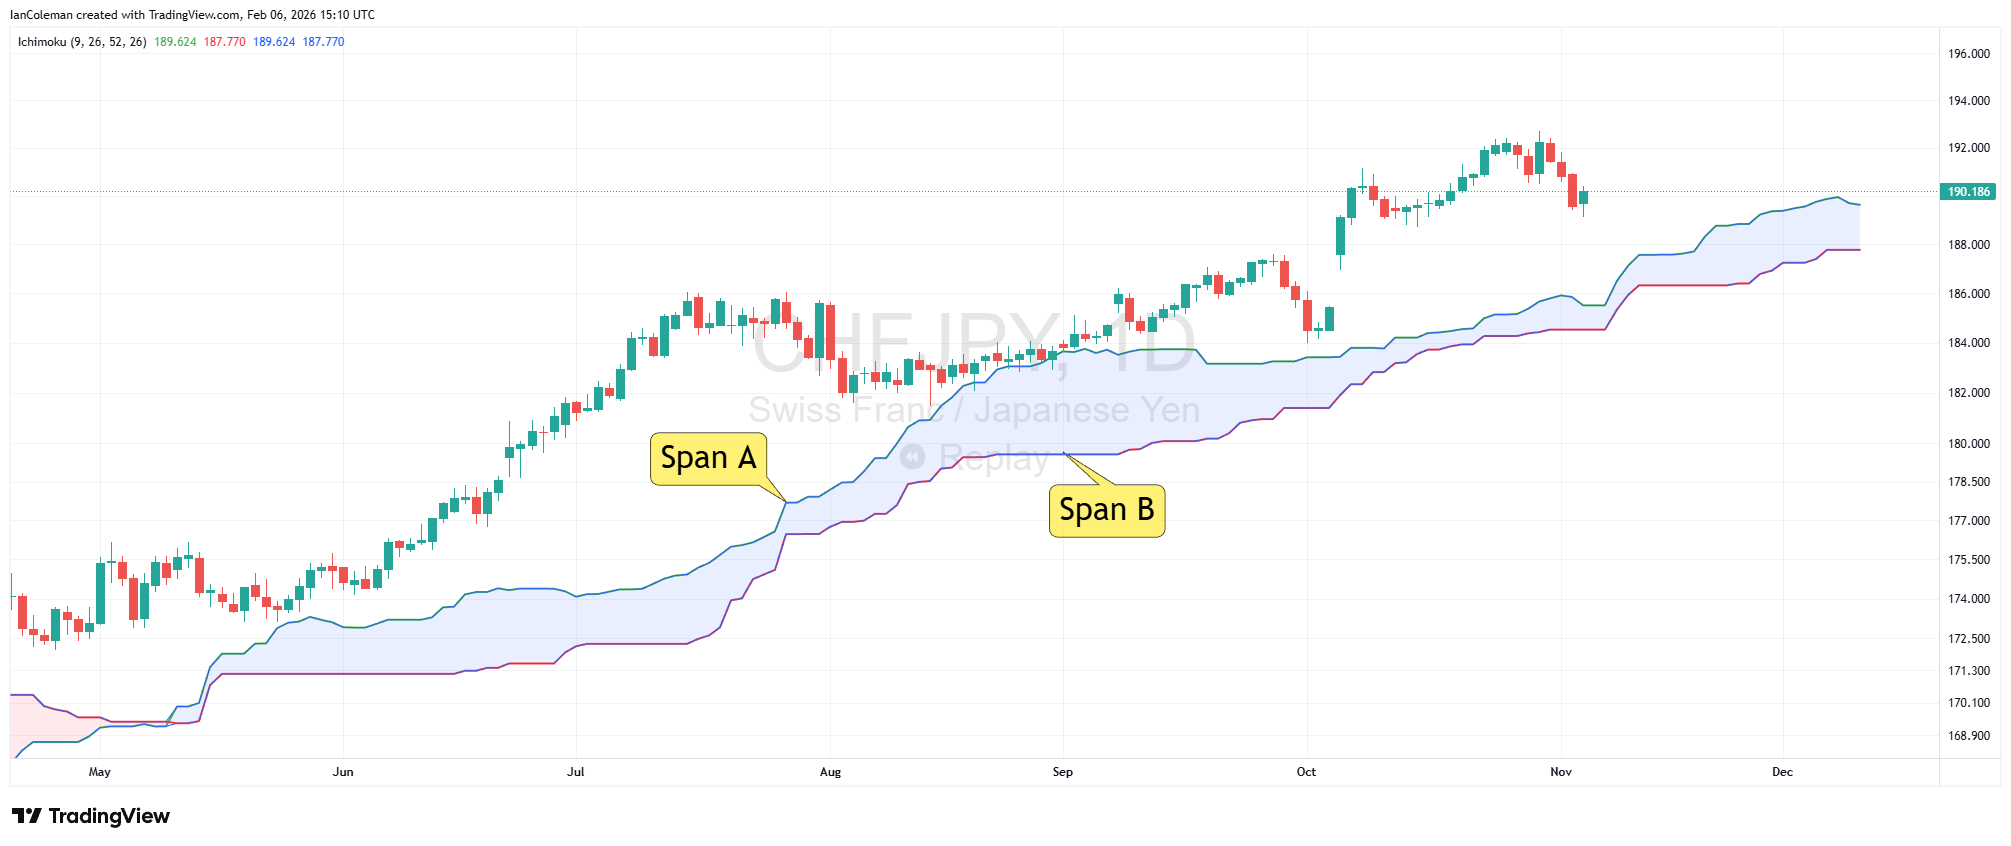
A bearish cloud forms when Senkou Span A is below Senkou Span B, typically displayed as a red cloud.

Span B, as the slower-moving boundary, often acts as a stronger and more reliable support or resistance level.

Forward-projected support, resistance, and trend bias

One of the defining characteristics of the Ichimoku Cloud is that it projects the cloud 26 periods into the future.

If the projected cloud remains red, it suggests the current bearish trend will likely continue. A shift to a bullish cloud acts as an early warning sign for sellers.

Projected cloud – Change of trend

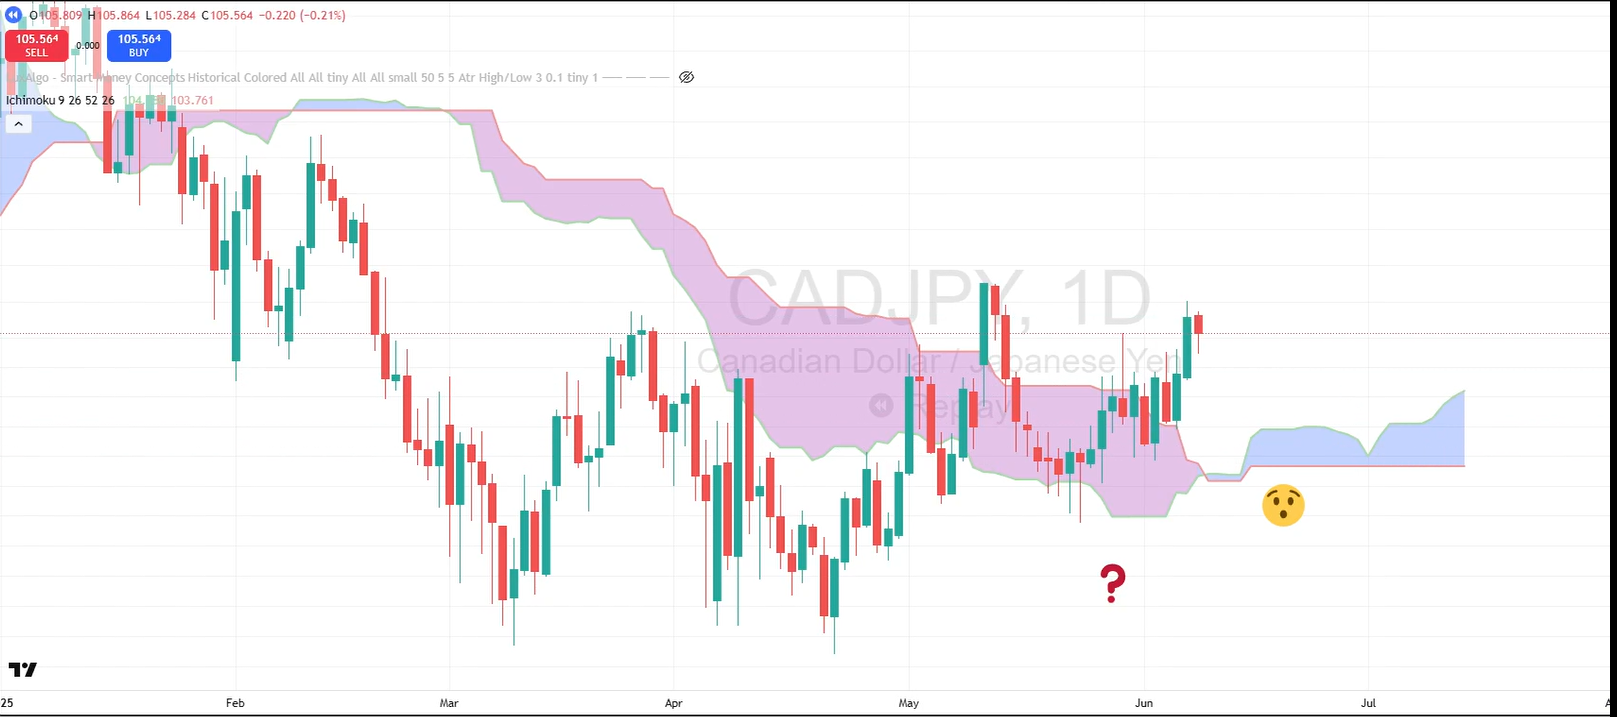
If the projected cloud remains green, it suggests that the current bullish trend should continue. A shift to a bearish cloud acts as a warning sign for buyers.

Using the Cloud as dynamic support and resistance

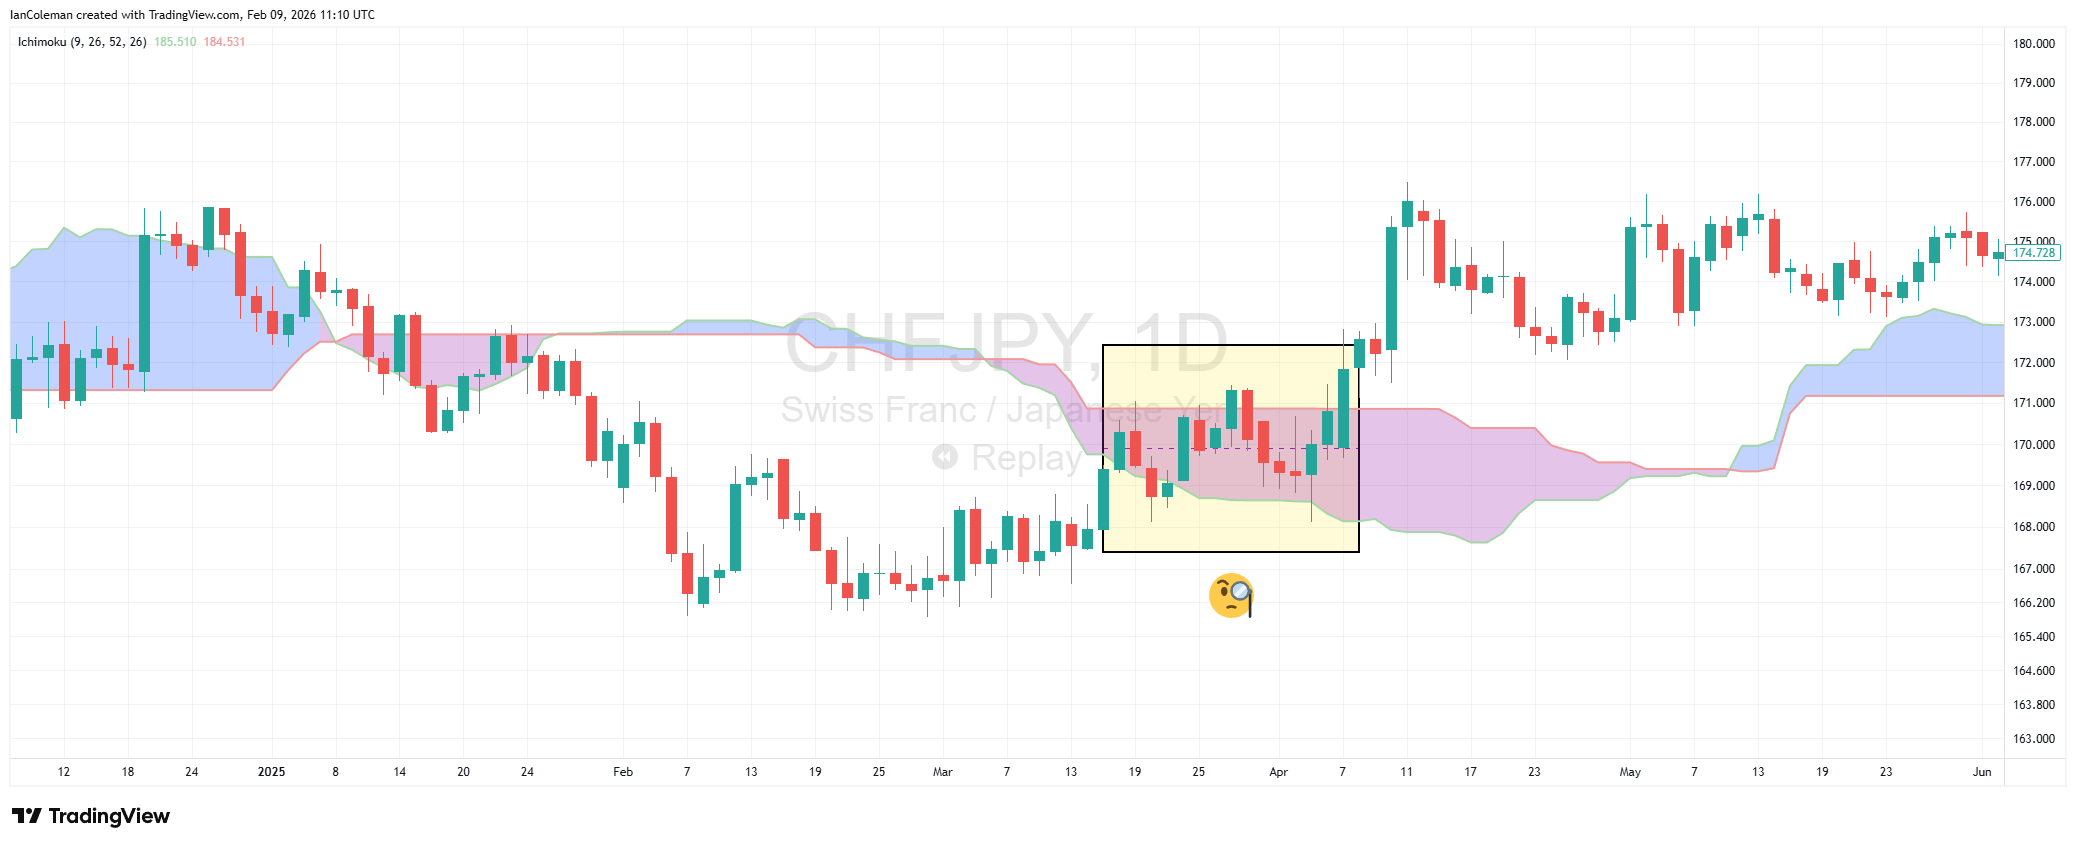
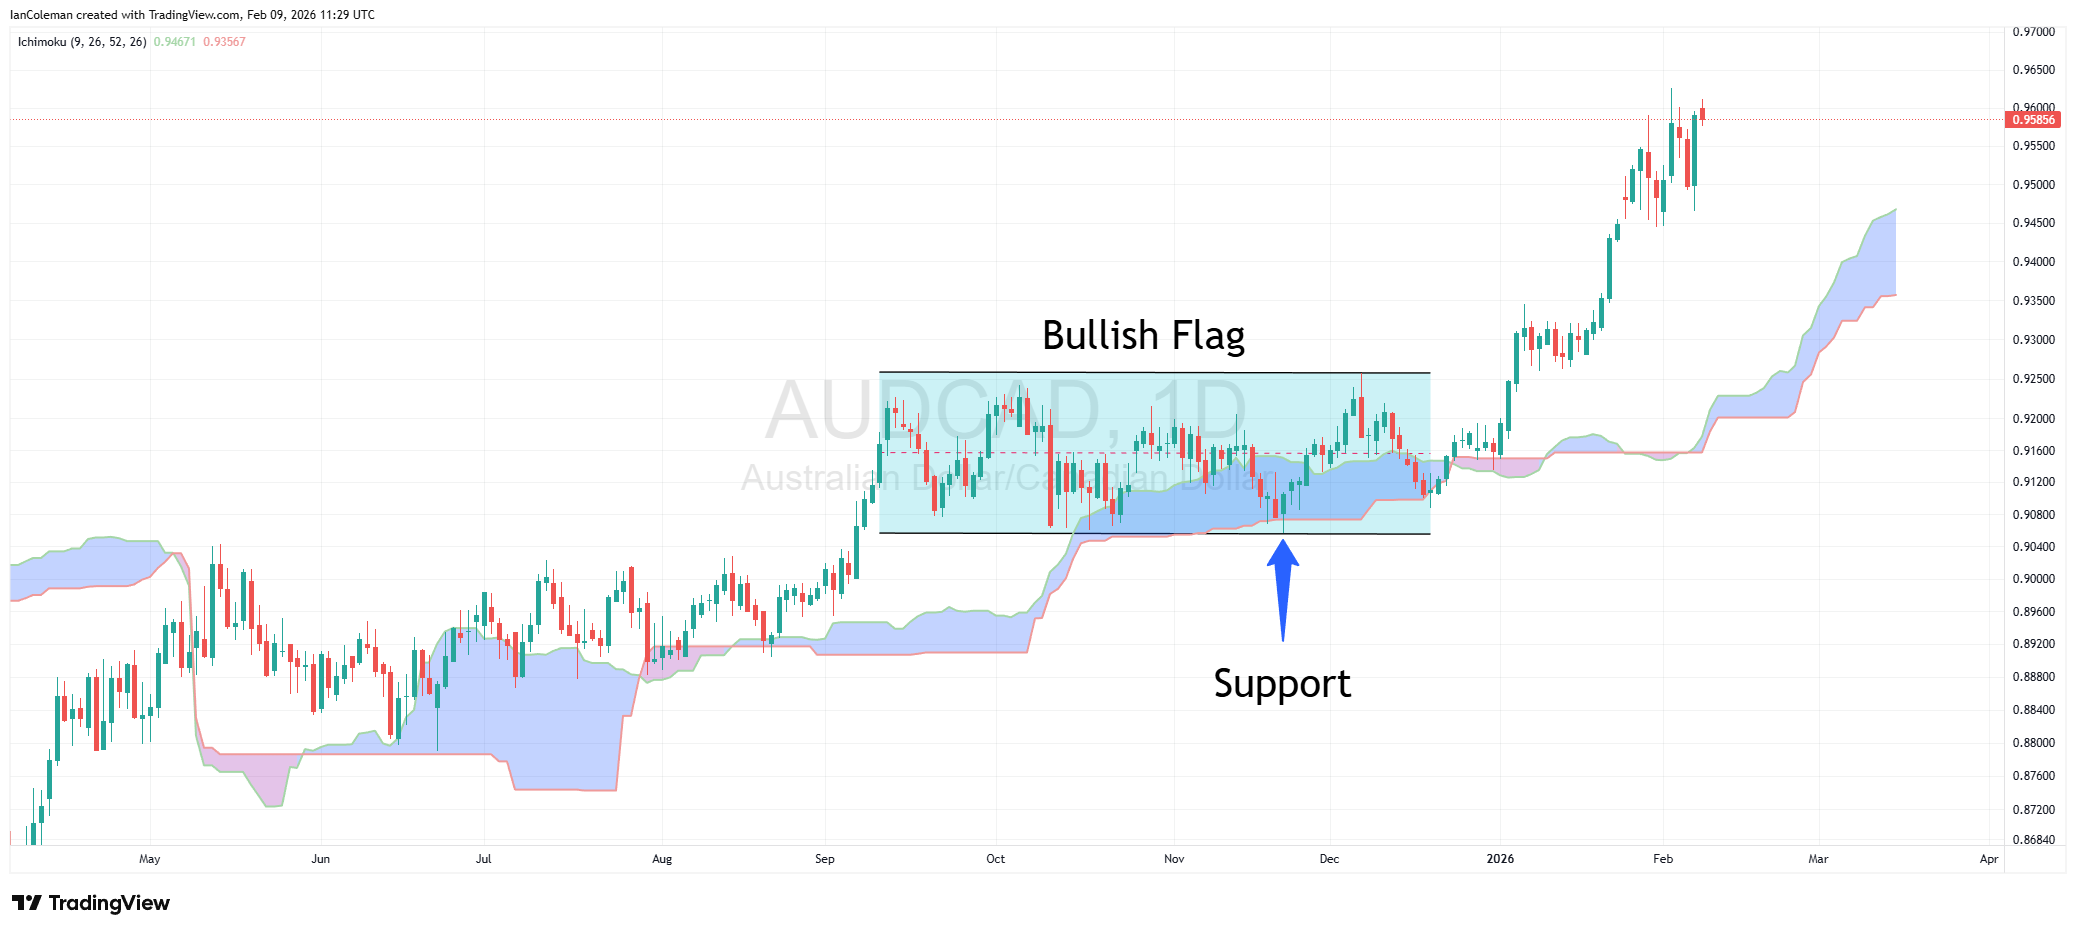
In its most basic application, both Senkou Span A and Senkou Span B can be treated as dynamic support and resistance levels. This makes the Ichimoku Cloud particularly useful for analyzing continuation patterns, such as flags and other consolidation structures.

Ichimoku Cloud providing support for a Bullish Flag pattern

Adding the lagging line to build a basic trading strategy

To construct a basic Ichimoku trading framework, we introduce one additional component: the lagging line.

The lagging line represents the current price projected 26 periods into the past. With this addition, the system now contains three core components, providing enough structure for a basic trend-following strategy.

A simple Ichimoku trend-following framework

In its most basic form, the Ichimoku Cloud trend-following trading strategy follows these principles:

  • A red cloud, combined with a red cloud projected 26 periods forward, signals that only sell trades should be considered.
  • The position of the lagging line relative to price 26 periods back confirms market structure.
  • Trade execution is focused around Senkou Span A.
  • The stop loss is placed on the opposite side of the trigger candle.
  • A minimum reward-to-risk ratio of two-to-one is targeted.

This framework highlights how the Ichimoku Cloud functions as a structured trend-following system rather than a reversal-based indicator.

(This article has been written using the help of an AI tool.)


Information on these pages contains forward-looking statements that involve risks and uncertainties. Markets and instruments profiled on this page are for informational purposes only and should not in any way come across as a recommendation to buy or sell in these assets. You should do your own thorough research before making any investment decisions. FXStreet does not in any way guarantee that this information is free from mistakes, errors, or material misstatements. It also does not guarantee that this information is of a timely nature. Investing in Open Markets involves a great deal of risk, including the loss of all or a portion of your investment, as well as emotional distress. All risks, losses and costs associated with investing, including total loss of principal, are your responsibility. The views and opinions expressed in this article are those of the authors and do not necessarily reflect the official policy or position of FXStreet nor its advertisers. The author will not be held responsible for information that is found at the end of links posted on this page.

If not otherwise explicitly mentioned in the body of the article, at the time of writing, the author has no position in any stock mentioned in this article and no business relationship with any company mentioned. The author has not received compensation for writing this article, other than from FXStreet.

FXStreet and the author do not provide personalized recommendations. The author makes no representations as to the accuracy, completeness, or suitability of this information. FXStreet and the author will not be liable for any errors, omissions or any losses, injuries or damages arising from this information and its display or use. Errors and omissions excepted.

The author and FXStreet are not registered investment advisors and nothing in this article is intended to be investment advice.

Editors’ Picks

EUR/USD retakes 1.1800 on renewed USD weakness

EUR/USD retakes 1.1800 on renewed USD weakness

EUR/USD gains ground after three days of losses, re-attempting 1.1800in the European trading hours on Thursday. The US Dollar sees fresh selling interest across the board, despite hawkish Fed Minutes, as the market mood improves and supports the pair. US Jobless Claims data, Fedspeak and geopolitics remain in focus. 

GBP/USD recovers above 1.3500 amid better mood

GBP/USD recovers above 1.3500 amid better mood

GBP/USD finds fresh demand and rises back above 1.3500 in the European session on Thursday. Improving risk sentiment and renewed US Dollar weakness are helping the pair recover ground ahead of mid-tier US data releases and Fedspeak. 

Japanese Yen hangs near one-week low vs. USD amid worries about Japan’s fiscal health

Japanese Yen hangs near one-week low vs. USD amid worries about Japan’s fiscal health

The USD/JPY pair gains positive traction for the second straight day – also marking the third day of a move up in the previous four – and climbs to over a one-week high, around the 155.35 area, on Thursday. Spot prices, however, retreat a few pips during the early European session and currently trade just above the 155.00 psychological mark, up nearly 0.20% for the day.


Editors’ Picks

EUR/USD retakes 1.1800 on renewed USD weakness

EUR/USD retakes 1.1800 on renewed USD weakness

EUR/USD gains ground after three days of losses, re-attempting 1.1800in the European trading hours on Thursday. The US Dollar sees fresh selling interest across the board, despite hawkish Fed Minutes, as the market mood improves and supports the pair. US Jobless Claims data, Fedspeak and geopolitics remain in focus. 

GBP/USD recovers above 1.3500 amid better mood

GBP/USD recovers above 1.3500 amid better mood

GBP/USD finds fresh demand and rises back above 1.3500 in the European session on Thursday. Improving risk sentiment and renewed US Dollar weakness are helping the pair recover ground ahead of mid-tier US data releases and Fedspeak. 

Gold clings to gains above $5,000 amid safe-haven flows and Fed rate cut bets

Gold clings to gains above $5,000 amid safe-haven flows and Fed rate cut bets

Gold sticks to modest intraday gains, above the $5,000 psychological mark, through the first half of the European session, though it lacks bullish conviction amid mixed cues. The third round of US-mediated negotiations between Ukraine and Russia concluded in Geneva on Wednesday without any major breakthrough.

Injective token surges over 13% following the approval of the mainnet upgrade proposal

Injective token surges over 13% following the approval of the mainnet upgrade proposal

Injective price rallies over 13% on Thursday after the network confirmed the approval of its IIP-619 proposal. The green light for the mainnet upgrade has boosted traders’ sentiment, as the upgrade aims to scale Injective’s real-time Ethereum Virtual Machine architecture and enhance its capabilities to support next-generation payments. The technical outlook suggests further gains if INJ breaks above key resistance.

Hawkish Fed minutes and a market finding its footing

Hawkish Fed minutes and a market finding its footing

It was green across the board for US Stock market indexes at the close on Wednesday, with most S&P 500 names ending higher, adding 38 points (0.6%) to 6,881 overall. At the GICS sector level, energy led gains, followed by technology and consumer discretionary, while utilities and real estate posted the largest losses.

RECOMMENDED LESSONS

5 Forex News Events You Need To Know

In the fast moving world of currency markets where huge moves can seemingly come from nowhere, it is extremely important for new traders to learn about the various economic indicators and forex news events and releases that shape the markets. Indeed, quickly getting a handle on which data to look out for, what it means, and how to trade it can see new traders quickly become far more profitable and sets up the road to long term success.

Top 10 Chart Patterns Every Trader Should Know

Chart patterns are one of the most effective trading tools for a trader. They are pure price-action, and form on the basis of underlying buying and selling pressure. Chart patterns have a proven track-record, and traders use them to identify continuation or reversal signals, to open positions and identify price targets.

7 Ways to Avoid Forex Scams

The forex industry is recently seeing more and more scams. Here are 7 ways to avoid losing your money in such scams: Forex scams are becoming frequent. Michael Greenberg reports on luxurious expenses, including a submarine bought from the money taken from forex traders. Here’s another report of a forex fraud. So, how can we avoid falling in such forex scams?

What Are the 10 Fatal Mistakes Traders Make

Trading is exciting. Trading is hard. Trading is extremely hard. Some say that it takes more than 10,000 hours to master. Others believe that trading is the way to quick riches. They might be both wrong. What is important to know that no matter how experienced you are, mistakes will be part of the trading process.

Strategy

Money Management

Psychology

Best Brokers of 2025