How to Trade with Candlestick Charts Like a Pro (Everything You Need to Know+Trading Applications+ Free E-Book)

Bonus Material: Get the Free E-book on Candlesticks
WHILE everyone is used to seeing the conventional line charts found in everyday life, the candlestick chart is a chart variant that has been used for around 300 years and discloses more information than your conventional line chart.
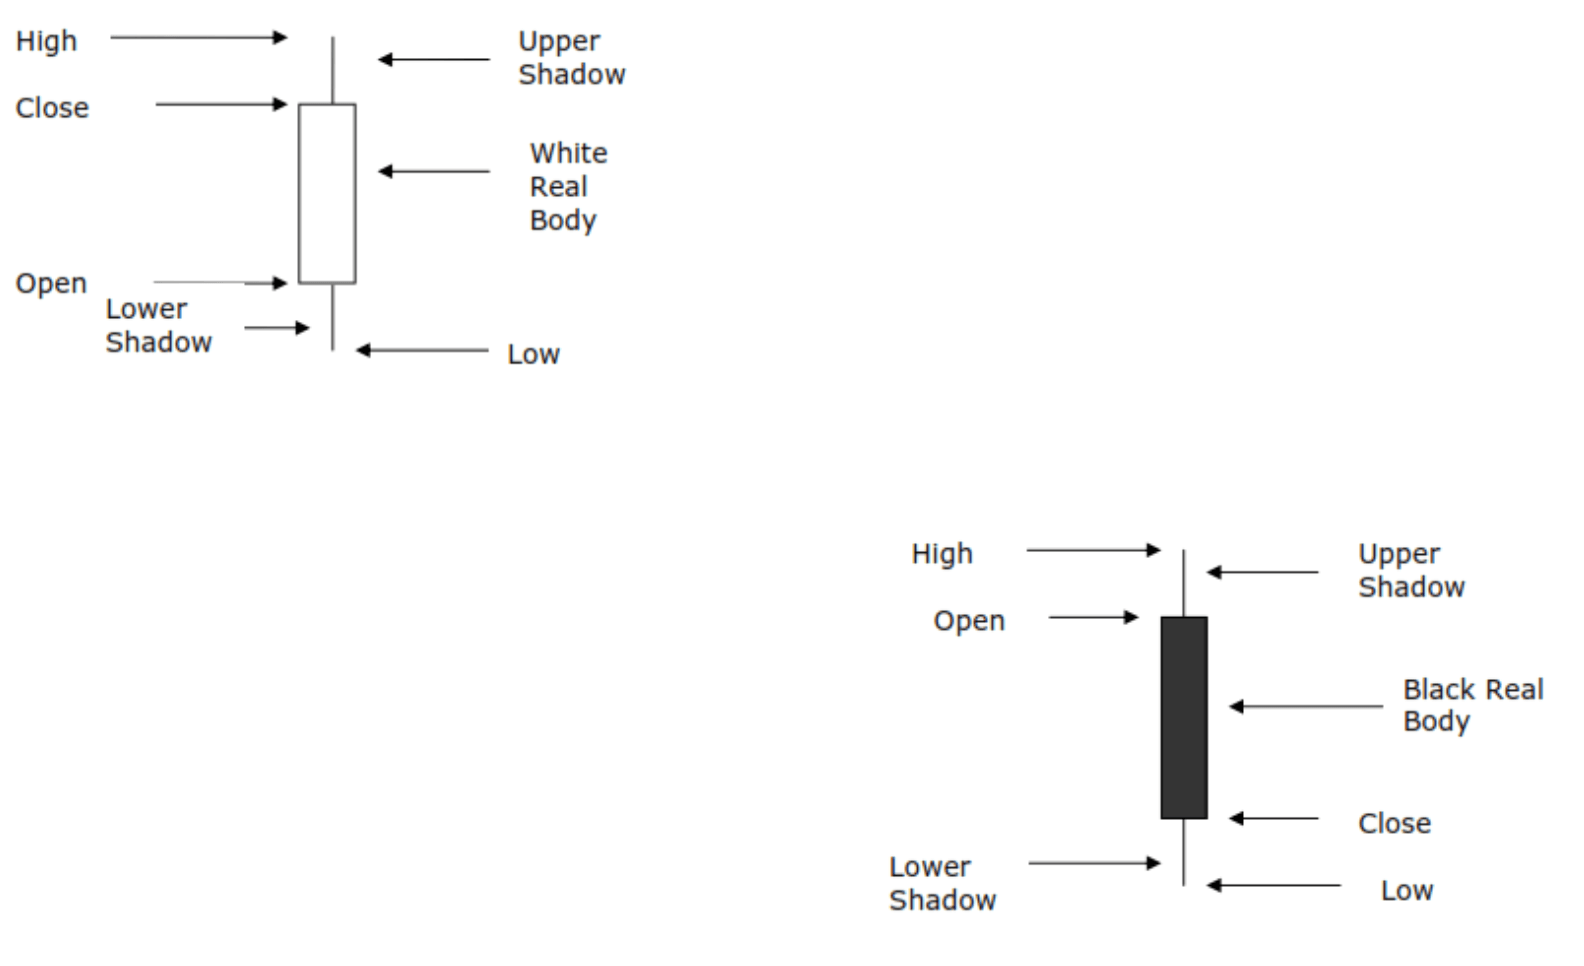
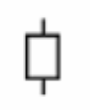
The candlestick is a thin vertical line showing the period’s trading range.
A wide bar on the vertical line illustrates the difference between the open and close.
Note: The daily candlestick line contains the currency’s value at open, high, low and close of a specific day.
The candlestick has a wide part, which is called the “real body“.
This real body represents the range between the open and close of that day’s trading.
When the real body is filled in or black, it means the close was lower than the open.
If the real body is empty, it means the opposite: the close was higher than the open.
Candlestick Charts
Just above and below the real body are the “shadows.”
Chartists have always thought of these as the wicks of the candle, and it is the shadows that show the high and low prices of that day’s trading.
When the upper shadow (the top wick) on a down day is short, the open that day was closer to the high of the day.
And a short upper shadow on an up day dictates that the close was near the high.
The relationship between the day’s open, high, low and close determine the look of the daily candlestick.
After viewing it, it is easy to see the wealth of information displayed on each candlestick.
At just a glance, you can see where a currency’s opening and closing rates, its high and low, and also whether it closed higher than it opened.
When you see a series of candlesticks, you are able to see another important concept of charting: the trend.
PART 1- Single Candles
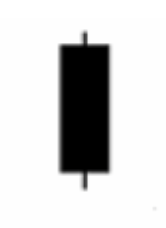
Long Black Day– Long black day candlestick consists of real body which is much more longer than it’s shadow lines. This indicate the great difference between the open price and the close price for a trading day. Long black day candlestick shows that the open price is near the high, price closes lower and near the low. The longer the body of the candlestick is, the more bearish the signal.
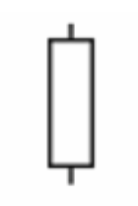
Long White Day– Long white day candlestick consists of real body which is much more longer than its shadow lines. This indicate the great difference between the open price and the close price for a trading day. Long white day candlestick shows that the open price is near the low, price closes higher and near the high. The longer the body of the candlestick is, the more bullish the signal.
Short White Day– In theory, the short white candle cannot make up its mind between a reversal or continuation of the existing trend. In the real world, it performs as a reversal 52% of the time, which is close to the theoretical indecision.

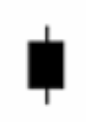
Short Black Day– The same is valid for the short black day candles. They are showing hesitance between a bullish and a bearish state. Not much happens with this candle, unless it is part of an “inside bar” candlestick formation.
White Spinning Tops– A type of candlestick formation where the real body is small despite a wide range of price movement throughout the trading day. This candle is often regarded as neutral and used to signal indecision about the future direction of the underlying asset. Usually in an uptrend when far away from resistance, it is considered a continuation pattern. It is the “breath” that the market takes just before a continuation of its current trend.
Black Spinning Tops– Тhe interpretation here is the same: A type of candlestick formation where the real body is small despite a wide range of price movement throughout the trading day. This candle is often regarded as neutral and used to signal indecision about the future direction of the underlying asset. In a downtrend, when there is no imminent support level, this is considered as a continuation pattern.

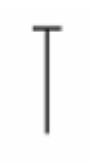
Dragonfly Doji– A type of candlestick pattern that signals indecision among traders. The pattern is formed when the stock’s opening and closing prices are equal and occur at the high of the day. The long lower shadow suggests that the forces of supply and demand are nearing a balance and that the direction of the trend may be nearing a major turning point.
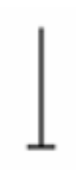
Gravestone Doji– A type of candlestick pattern that is formed when the opening and closing price of the underlying asset are equal and occur at the low of the day. The long upper shadow suggests that the day’s buying buying pressure was countered by the sellers and that the forces of supply and demand are nearing a balance. This pattern is commonly used to suggest that the direction of the trend maybe be nearing a major turning point. If it forms around major resistance area, it might be considered as a reversal candle.
Long-Legged Doji– A type of candlestick formation where the opening and closing prices are nearly equal despite a lot of price movement throughout the trading day. This candlestick is often used to signal indecision about the future direction of the underlying asset. Usually in the middle of the range, it could be taken as a continuation signal of the previous trend.

PART 2 – Candlestick Patterns (2 candles)
Harami– this candlestick is also known as an “Inside Bar“. A candlestick that forms within the real body of the previous candlestick is in harami position. Harami means ‘pregnant’ in Japanese and the second candlestick is nestled inside the first. The first candlestick usually has a large real body and the second a smaller real body than the first. The shadows (high/low) of the second candlestick do not have to be contained within the first, though it’s preferable if they are. Doji and spinning tops have small real bodies and can form in the harami position as well.
Hammer– a.k.a. “Pin Bar”. it signals a reversal after a downtrend – control has shifted from sellers to buyers. The shadow should be at least twice the height of the body. If it occurs after an up trend, it is called a ‘hanging man‘ and is a bearish signal. A gravestone is identified by open and close near the bottom of the trading range. This is really the converse of a hammer and signals a reversal when it occurs after an up-trend.

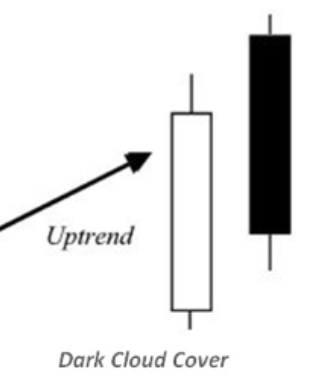
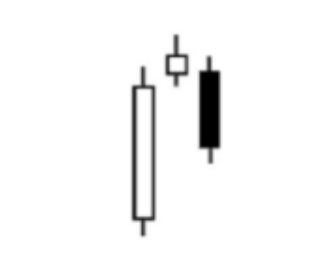
Dark Cloud– it is a pattern encountered after an up-trend and is a reversal signal warning of “rainy days” ahead. A bearish reversal pattern that continues the uptrend with a long white body. The next day opens at a new high then closes below the midpoint of the body of the first day.
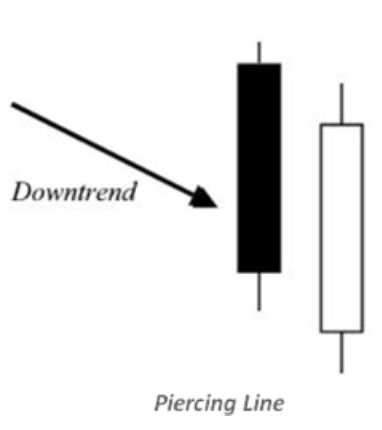
The Piercing Line– it is the opposite of the Dark Cloud pattern and is a reversal signal if it appears after a downtrend. The first day, in a downtrend, is a long black day. The next day opens at a new low, then closes above the midpoint of the body of the first day.
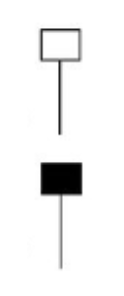
Engulfing– Engulfing patterns (shown above) consist of two bodies without any shadows and where the second body ‘engulfs’ the first. The picture on the left is an example of a bullish engulfing pattern. They usually mean a bullish continuation. The candlestick pattern on the right is a bearish engulfing pattern. It is very significant at market tops, where sellers are “engulfing” the last standing buyers and push the price lower.
These signals are especially significant after a prolonged trend. I spend a lot of time on this candlestick pattern in my trading course. I am using it extensively and together with the pin bar, they are two of the most commonly used candlestick patterns by me. They are crucial when it comes to the “scaling-in method” I use.
PART 3- Candlestick Patterns (3 candles)
Stars– Stars are made up of a long body followed by a short body with a much smaller shadow (trading range). The bodies of the two must not overlap, though the shadows may. There are three major star candlestick patterns, which I will discuss below.
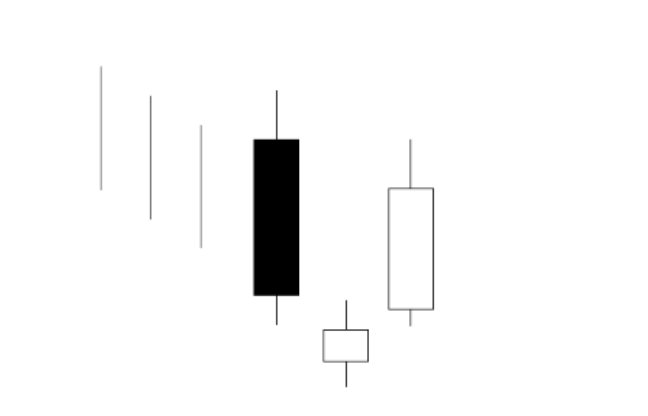
Morning Star
The Morning Star pattern is a bullish reversal signal after a downtrend (as portrayed above). The first bar has a long black body, the second body gaps down from the first (the shadows may still overlap) and may be filled or hollow. This is followed by a long white body, which closes in the top half of the body of the first bar.
Evening Star Pattern
The Evening star pattern is opposite to Morning Star and is a reversal signal at the end of an up-trend. Evening star is a three-candle pattern that comes after a rally. The first candle has a tall white real body, the second has a small real body that gaps higher to form a star, and the third is a black candle that closes well into the first session’s white real body.
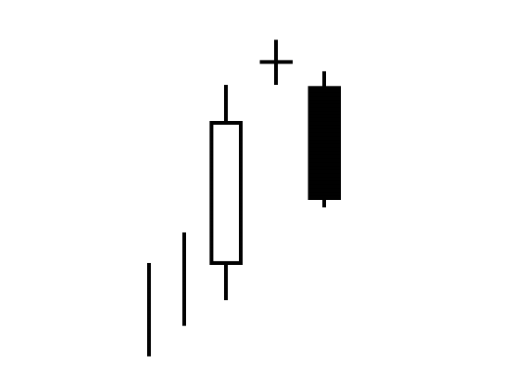
Doji Star
A Doji Star formation is weaker than the Morning or Evening Star – the doji represents indecision. With a Shooting Star the body on the second bar must be near the low – at the bottom end of the trading range. The upper shadow must be longer. This is also a weaker reversal signal after a trend. Both of these patterns require confirmation – by the next bar closing below halfway on the first bar.
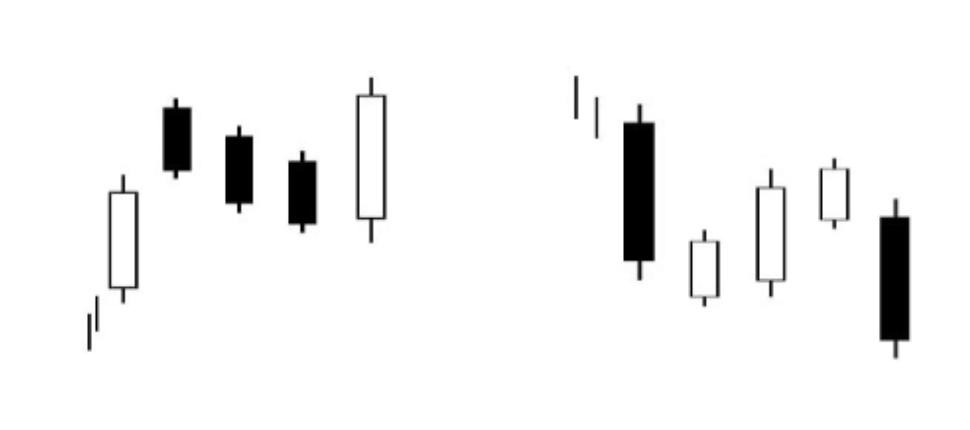
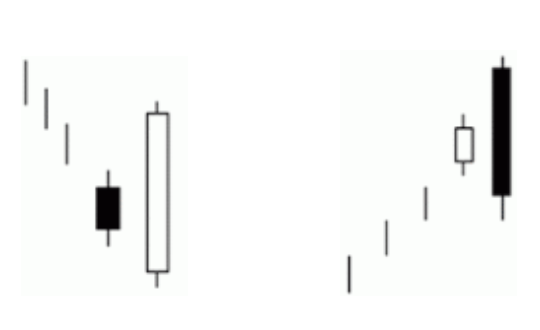
Rising and Falling Three Methods
The Rising Method (pictured to the left) consists of two strong white lines bracketing three or four small declining black lines. The final white line forms a new closing high. The pattern is definitely bullish.
The Falling Method (pictured to the right) is bracketed by strong black bars, the second black bar forming a new closing low. This is definitely a bearish candlestick pattern. It usually forms in the middle of the range in a downtrend.
PART 4- Applications
A) Candlesticks with Support and Resistance
WHAT IS SUPPORT
Although it is a relatively simple to understand concept, most of the traders are using it in different ways and find it difficult to apply. That is why, I do consider it important to be covered, since I am probably using it in a different way than many other traders. I have covered this topic very extensively in my comprehensive Support and Resistance article. In the next few screenshots, you will find an explanation of support and resistance with real life examples.
Question:Try to find the candlestick patterns that formed around the major levels.

In the chart above, you can see a multi-month support level marked by the price touching the same level on the chart. In this case, the support level is located at 13,900. We can see that the price did come close to this level and re-bounced at least four times.
Answer: Above the first blue arrow, the candlestick pattern that formed is an inside bar. Above the second blue arrow, there is a pin bar that formed. The third arrow is showing us a bullish engulfing pattern. The fourth arrow is showing a pin bar and a bullish engulfing pattern afterwards. All of those candlesticks lead the price higher.
Support is a level, at which demand is strong enough to prevent price from declining further. That means that around this support level sellers are less hesitant to continue selling and buyers take control over price. This level is seen by market participants as an equilibrium level, where money is exchanging hands. Thus, support can be established with previous reaction lows. Traders know that technical analysis is not a precise science and thus experience comes handy when projecting support levels.
WHAT IS RESISTANCE
The resistance level is established by using the previous reac.on highs. The concept of resistance is exactly the opposite of what support represents. Resistance level is a level at which, buyers are more hesitant to continue buying and sellers come in to push the price lower. In the FTSE example below, you can see a multi-month resistance level. There are at least 7 times when the price is reaching to the level of 6,900. It is located just below the 7,000 psychological barrier.
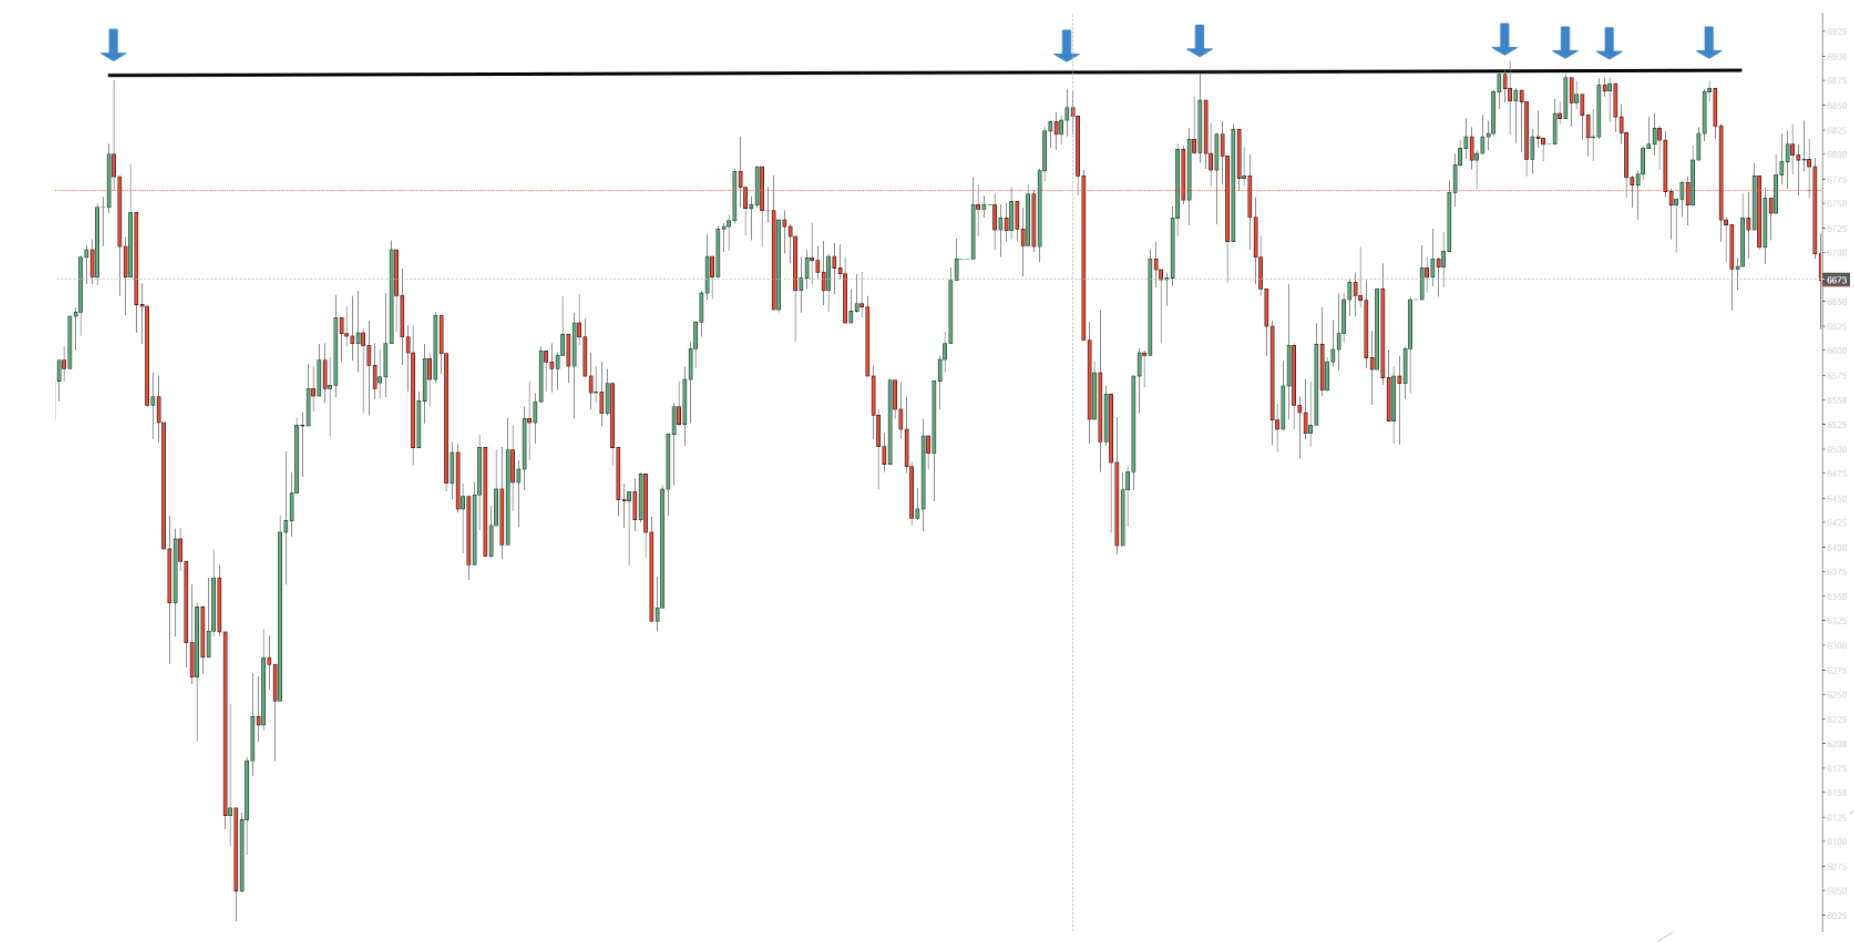
Question: Just like above, try to find all the candlestick patterns that formed on that level.
Resistance is a place of equilibrium, where money is exchanging hands. Demand at such levels is not enough and that is why price starts declining. For how I use resistance, you will learn more in the Support and Resistance article I have referred to above. You can have a look at another article on support and resistance, where I am walking my followers through real life examples.
B) Candlesticks with Moving Averages
A moving average offers great support and resistance. The bigger the period the moving average considers, the stronger the support and resistance area.
Moreover, the bigger the time frame, the stronger the support and resistance. In other words, when the price hits a 200 EMA on the monthly chart, there’s a strong likelihood it will hesitate at the level.
Further, price acts around moving averages just like it does around a classical trend line. Once broken, the support becomes resistance. Once resistance gets broken, it turns into support.
However, when compared with classical support or resistance, the one provided by moving averages is more powerful. It is called dynamic support and resistance. Look at the EURUSD screenshot below
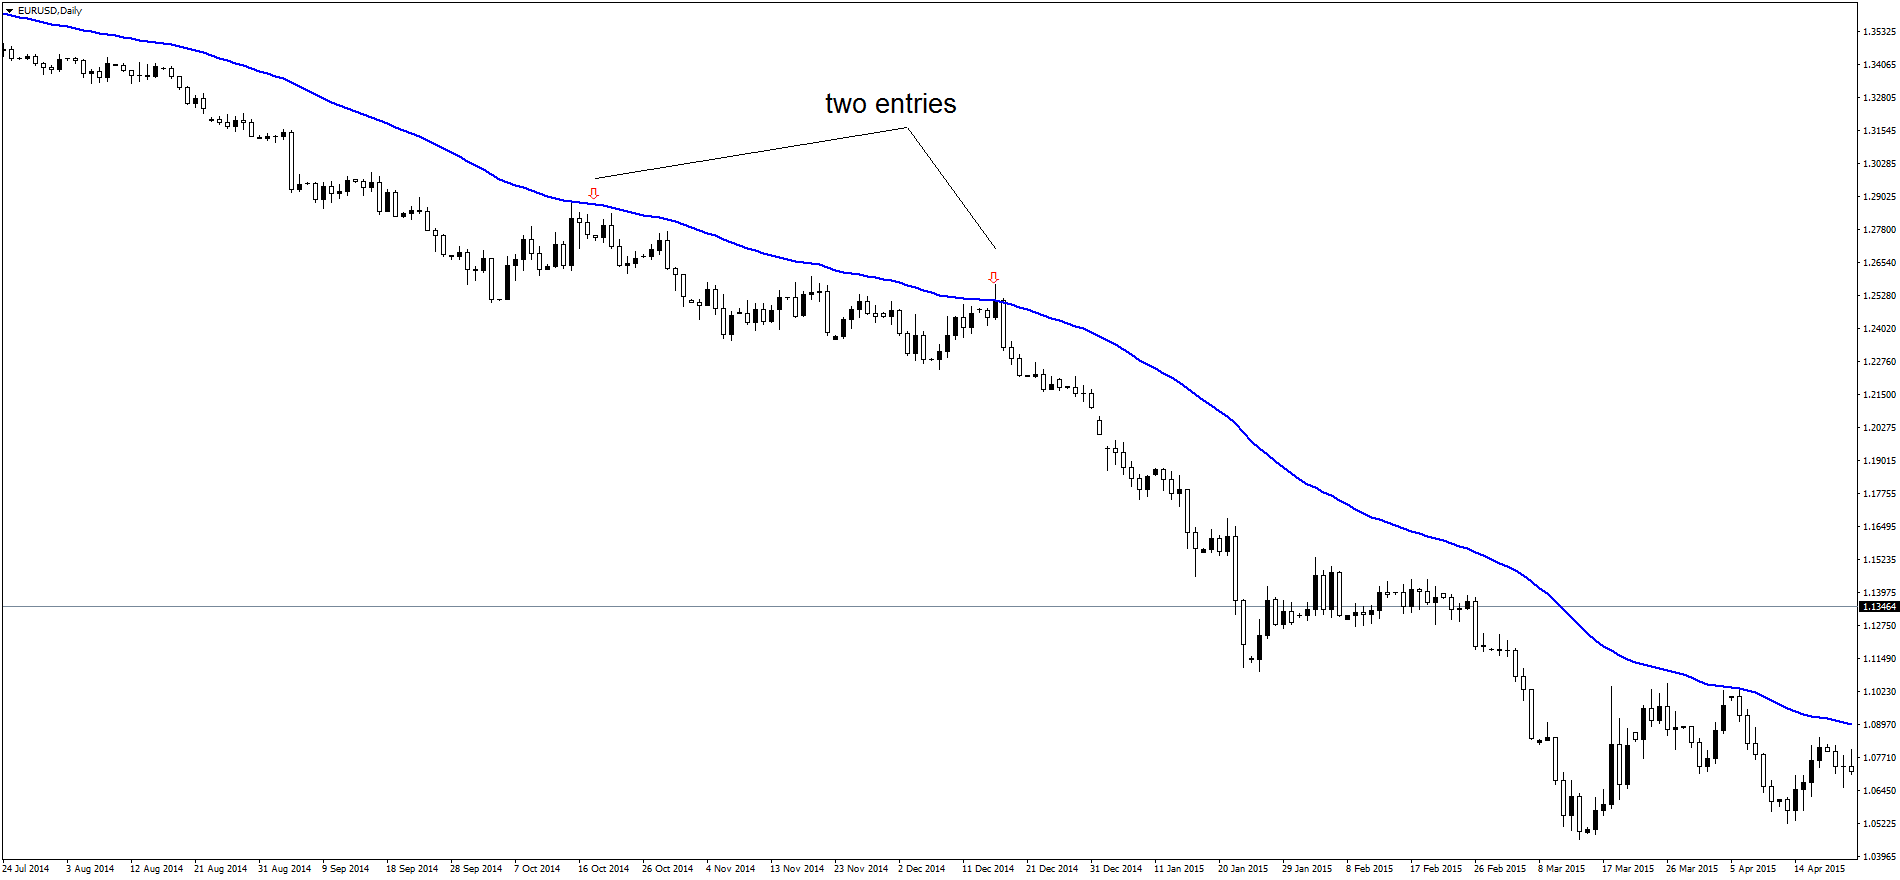
In fact, it means it moves together with price. Due to the way they’re calculated, traders use moving averages to trail stops when riding a trend.
Others use them to add positions to a strong trend. As a rule of thumb, the more price comes to a moving average, the weaker the trend becomes.
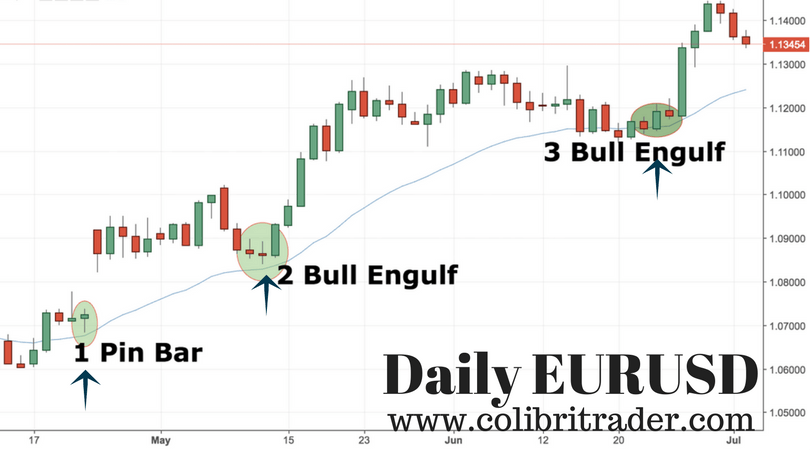
Example 1– Trading Moving Averages with Candlestick Charts
As you can see from the screenshot below, EURUSD has been in a steady uptrend for the past few months. Moving averages (MA) can be used to enter in a trade once the trend has been established. If you are using candles in conjunction with MAs, then you might be onto something great. What can be said by looking at the EURUSD chart below:
Example 2– Trading Candlesticks with Two Moving Averages
When traders are looking using two moving averages to trade, they usually are waiting for a crossover. If you have a crossover and a confirmation from a candlestick chart, that is great. Let me give you an example of those, so you can better visualise it.
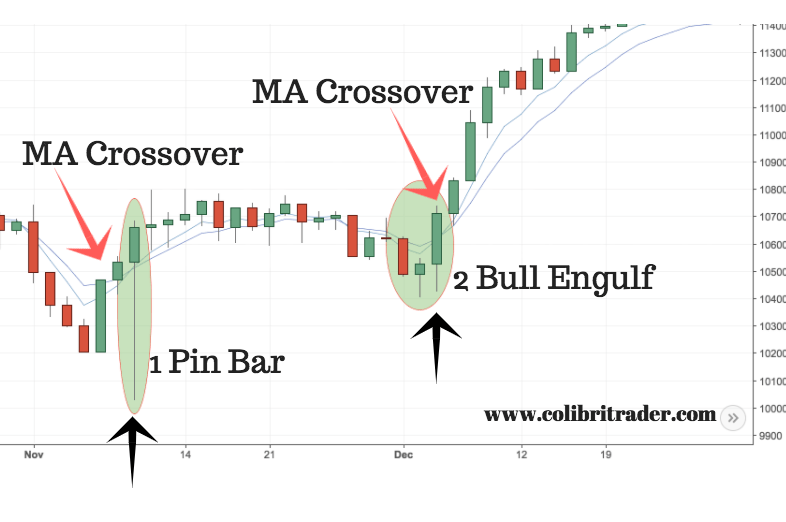
As you can see from the DAX (Germany 30) screenshot above, we had two positive crossovers. (A positive crossover occurs when the shorter-term moving average crosses above the longer-term moving average.) At these areas we have 1) pin bar forming and 2) two bullish engulfing pattern. A confluence of factors is leading the price higher and continuing the bullish trend.
CONCLUSION
A lot can be said and written about candlestick charts. In the end what matters is how are you going to apply that knowledge. Some of the most important sub-topics of that article are:
-
What are candlesticks and how are they used
-
Different types of single candles
-
Candlestick formations (two or more candles)
-
Applications
In the last past (Applications), I walked you through two different approaches of using candlesticks. First, I showed you how to use candlesticks in conjunction with support and resistance.
Second, I showed you how candlesticks are used with moving averages. I also gave a few real life examples down the line to make it more visual. All in all, I hope that this detailed candlesticks article has given you enough information, so you can make a more informed trading decision.
Author

Colibri Trader
Colibri Trader
Colibri Trader, as he is known in the circles, is based in London, UK. He Started his career in one of the leading prop trading houses at the time and then has moved out to form his own company- Colibri Trader Limited.


