How to trade using astro trendline: CrowdStrike crash example

On July 19, the largest IT outage in history occurred, causing the stock prices of Microsoft and CrowdStrike to nosedive.
But was this event a disaster or a golden ticket for traders?
You may have already done some stock analysis.
And many traders dive into W.D. Gann’s methods only to end up more confused.
Deciphering which planets to focus on, predicting trends, and aligning charts can be overwhelming.
However, Astro trading, when done right, can add another layer of precision to your trades.
In this post, you'll learn how to draw Astro Trendline step by step:
- How to identify significant planetary alignments.
- Methods to plot price action for clear trends.
- Connect the Dots.
- Drawing accurate astro-trendlines.
- Mastering timing and precision with astro-trendlines.
Stay tuned as we break down each step, making the complex world of Astro Trading simple and actionable.
Step 1: Identify significant planetary alignments
Ever felt like you’re always just a step behind the curve? Knowing when the market is about to turn is crucial. To master this, start by identifying those key planetary alignments.
Pay attention to hard aspects
Here's a game-changer: hard aspects of major planets often coincide with important turning points in financial markets.
Tips:
- Keep a calendar of major planetary movements.
- Don’t waste money on expensive Astro software; use your ephemeris.
- Monitor major planets like Jupiter, Saturn, Mars, and Venus.
Step 2: Plot price action for clear trends
Now that you know when these alignments happen, the next step is to see how price action behaves.
Find significant highs and lows
These highs and lows define the trend you’re looking at. They are your first clues.
Example:
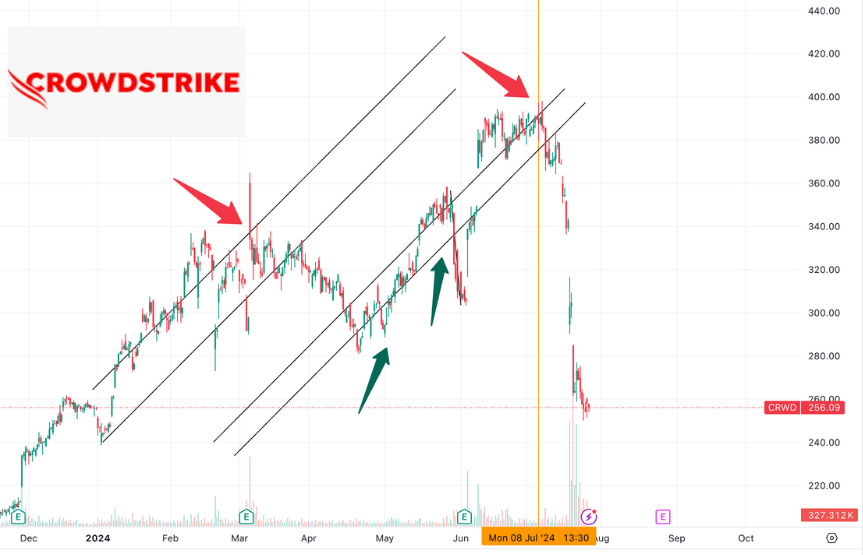
Think of the times CrowdStrike's stock dropped suddenly. If you look back at the periods when highs were formed, you might notice a pattern related to planetary alignments.
Step 3: Connect the Dots
The cool part about this method is seeing how planetary alignments match with market extremes. These are your astro "anchor points."
Feeling more confident? You should. Astro trading might seem complex, but it breaks down into easy steps.
By knowing planetary alignments, plotting price action, and aligning them, you create a clear picture of market behavior.
Next up: We'll explore how to draw these astro-trendlines and nail down timing for better market entry.
Step 4: Draw the astro-trendline
Start with a baseline: Draw a line from one planetary anchor point to the next. This represents your Astro-trendline.
Check for Consistency: Make sure this line connects key highs and lows. That’s your Astro-trendline at work.
CrowdStrike was listed in 2019. The best part is that you don’t need a long data history for back-testing. You can do this in less than 30 minutes.
That’s your astro-trendline at work.
Step 5: Mastering timing and precision with astro-trendlines
Timing can make or break your trades. Here’s how to get it right with astro-trendlines.
Mathematical trading methods can add another layer of precision to your astro-trendline analysis.
This gives you a clearer perspective on discerning the trend, allows for more precise market entries, and improves accuracy.
Example:
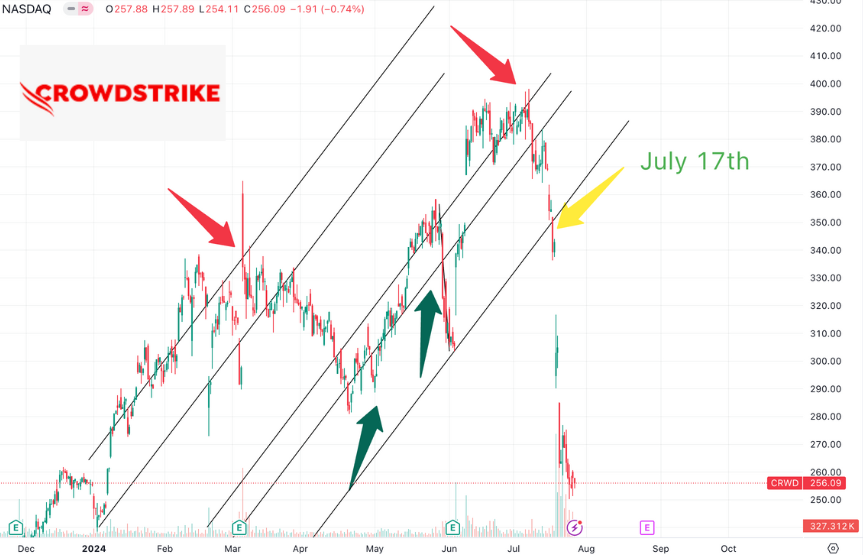
When CrowdStrike experienced a major dip and broke the Astro-trendline,
WD Gann’s mathematics gives you more accurate points to exit or short-sell the stock 2 days before the crash on July 19th.
Recap
- Start by identifying significant planetary alignments.
- Plot the price action and align these celestial events.
- Draw and validate your astro-trendline.
- Combine this with Gann mathematics for precise entry and exit points.
Final thought:
Astro trading takes practice, but the returns can be worthwhile.
It adds a unique layer of insight that you won’t get from any conventional technical indicators.
Author

Khit Wong
Gann Explained
As a noted expert on FXStreet.com and in “Technical Analysis of Stocks & Commodities” and "Traders World," I specialize in applying W.D. Gann's complex theories to practical trading.


