![]() Sam Seiden
Sam Seiden
Independent Analyst
Question: When will the market fall?
Answer: Focus on what’s real, not what you feel. While there are many signs pointing to a severe market crash, Fearing a stock market crash without knowing what the warning signs are or what they mean is fruitless. In fact, fearing a stock market crash at all is fruitless as that fear won’t help you protect your investments. Instead, put your energy into learning how to read the markets and implement proven strategies that can help you not only protect your investments but take advantage of drops in the market.
Warning Signs of a Stock Market Drop
-
Consumer confidence is the highest it has been in 18 years (where it was right before the 2000 market crash)
-
There are a record number of short positions in the 10 and 30 year treasuries
-
There are a record number of short positions in Gold
-
The debt to GDP ratios are the largest they’ve been in decades for major G-10 countries
-
We are seeing a flattening to inverted yield curve
There are other indications of an imminent stock market drop as well. For example, some of the worst market declines in history were preceded by lower-than-average volatility, stronger-than-average earnings, strong GDP growth and bullish sentiment — 1929, 1987, 2000 and 2007. However, all these indications shouldn’t trigger an automatic selloff of your market positions.
What I have learned, lived through, profited from over my 20+ years trading and managing money in the markets is to focus on what is real, not what I feel. While the fundamentals are suggesting a downturn in stock prices is coming but, typically, the market will go up another 5 – 10% before falling. This means fundamentals don’t offer much help with respect to timing the market’s turning points. While there is no doubt in my mind a market down turn is coming, I and those in my live trading sessions will wait for the real trigger to tell us when to take action, action we will be prepared for.
S&P 500 Daily Chart
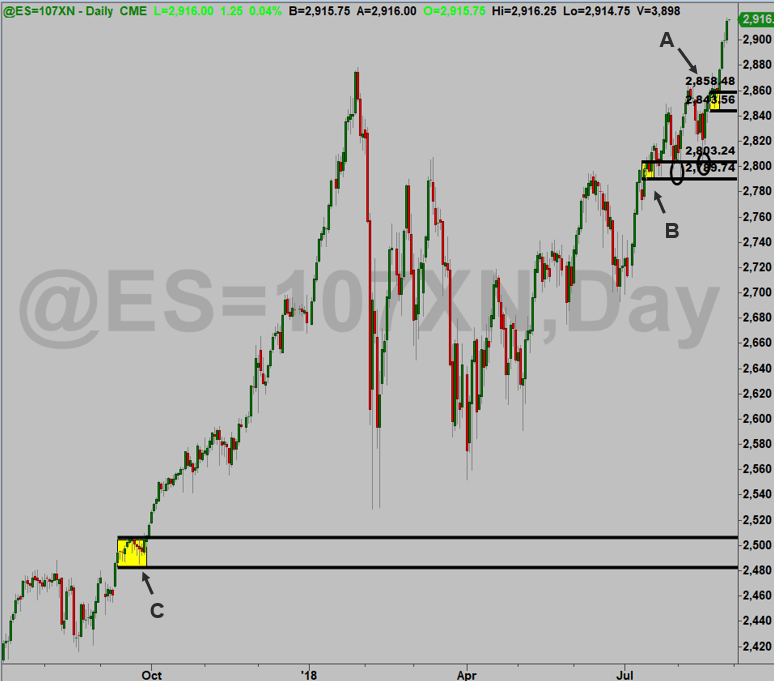
The chart above is a daily chart of the S&P 500 as of today, 8/29/18. Areas marked (A), (B), and (C) are demand zones. A and C are fresh demand zones. B is a demand zone where we were buyers when price returned to it so it’s not fresh any longer. Area A, however, is a fresh demand zone. So, when price revisits it, we will again be buyers as we have the entire rally. However, once price revisits one of our demand zone, A (or another), and goes through it, that will be the market telling us objectively that it has reached a level, or price point, where supply exceeds demand. Then and only then will we stop buying and, instead, go into protection mode, sell short mode, and get ready to buy a bottom mode. This is certainly not the first time this has happened, and it won’t be the last.
Back in 2008, the market experienced one of the biggest crashes in history. As you can see below in a live online trading session I was delivering for members, price came right down into a fresh demand zone on the monthly chart (a gift of a life time!). Notice, however, how horrible the news was; and that news was very real. The severity of the negative news is what caused the masses to sell stock because that’s simply what people do. However, as bad and real as the economy was, price was at demand with a massive profit zone to the upside. We followed our non-emotional simple rules, bought, and the market has gone up ever since that 2009 low.

Everyone talks about a market crash; when they do, they mean a crash to the downside. No one ever talks about the biggest market crashes of all, the ones to the upside. These dwarf the occasional down turn in a market so we don’t want to miss them. As I have said so many times… the equity index markets are designed to go up over time for many reasons. By following simple rules, you can make this next market crash to the downside, and the one that follows to the upside, market moves that don’t hurt you but instead allow you to enjoy huge profits. This is all with the goal of making enough money to live the life you choose.
Read the original article here - How to Trade Profitably Through a Market Crash
Note: All information on this page is subject to change. The use of this website constitutes acceptance of our user agreement. Please read our privacy policy and legal disclaimer. Opinions expressed at FXstreet.com are those of the individual authors and do not necessarily represent the opinion of FXstreet.com or its management. Risk Disclosure: Trading foreign exchange on margin carries a high level of risk, and may not be suitable for all investors. The high degree of leverage can work against you as well as for you. Before deciding to invest in foreign exchange you should carefully consider your investment objectives, level of experience, and risk appetite. The possibility exists that you could sustain a loss of some or all of your initial investment and therefore you should not invest money that you cannot afford to lose. You should be aware of all the risks associated with foreign exchange trading, and seek advice from an independent financial advisor if you have any doubts.
Editors’ Picks

EUR/USD trims losses, back to 1.1830
EUR/USD manages to regain some composure, leaving behind part of the earlier losses and reclaim the 1.1830 region on Tuesday. In the meantime, the US Dollar’s upside impulse loses some momentum while investors remain cautious ahead of upcoming US data releases, including the FOMC Minutes.

GBP/USD bounces off lows, retargets 1.3550
After bottoming out just below the 1.3500 yardstick, GBP/USD now gathers some fresh bids and advances to the 1.3530-1.3540 band in the latter part of Tuesday’s session. Cable’s recovery comes as the Greenback surrenders part of its advance, although it keeps the bullish bias well in place for the day.

USD/JPY is looking for direction around 153.00 with key US data in focus
USD/JPY reversal from 153.70 has been contained above 152.70 on Tuesday. Major currencies are trading within narrow ranges amid thin trading volumes. Investors await the release of the US GDP and PCE Inflation figures to make decisions.
Editors’ Picks
EUR/USD trims losses, back to 1.1830
EUR/USD manages to regain some composure, leaving behind part of the earlier losses and reclaim the 1.1830 region on Tuesday. In the meantime, the US Dollar’s upside impulse loses some momentum while investors remain cautious ahead of upcoming US data releases, including the FOMC Minutes.
GBP/USD bounces off lows, retargets 1.3550
After bottoming out just below the 1.3500 yardstick, GBP/USD now gathers some fresh bids and advances to the 1.3530-1.3540 band in the latter part of Tuesday’s session. Cable’s recovery comes as the Greenback surrenders part of its advance, although it keeps the bullish bias well in place for the day.

Gold remains offered below $5,000
Gold stays on the defensive on Tuesday, receding to the sub-$5,000 region per troy ounce on the back of the persistent move higher in the Greenback. The precious metal’s decline is also underpinned by the modest uptick in US Treasury yields across the spectrum.

Crypto Today: Bitcoin, Ethereum, XRP upside looks limited amid deteriorating retail demand
The cryptocurrency market extends weakness with major coins including Bitcoin (BTC), Ethereum (ETH) and Ripple (XRP) trading in sideways price action at the time of writing on Tuesday.

UK jobs market weakens, bolstering rate cut hopes
In the UK, the latest jobs report made for difficult reading. Nonetheless, this represents yet another reminder for the Bank of England that they need to act swiftly given the collapse in inflation expected over the coming months.
RECOMMENDED LESSONS
Making money in forex is easy if you know how the bankers trade!
I’m often mystified in my educational forex articles why so many traders struggle to make consistent money out of forex trading. The answer has more to do with what they don’t know than what they do know. After working in investment banks for 20 years many of which were as a Chief trader its second knowledge how to extract cash out of the market.
5 Forex News Events You Need To Know
In the fast moving world of currency markets where huge moves can seemingly come from nowhere, it is extremely important for new traders to learn about the various economic indicators and forex news events and releases that shape the markets. Indeed, quickly getting a handle on which data to look out for, what it means, and how to trade it can see new traders quickly become far more profitable and sets up the road to long term success.
Top 10 Chart Patterns Every Trader Should Know
Chart patterns are one of the most effective trading tools for a trader. They are pure price-action, and form on the basis of underlying buying and selling pressure. Chart patterns have a proven track-record, and traders use them to identify continuation or reversal signals, to open positions and identify price targets.
7 Ways to Avoid Forex Scams
The forex industry is recently seeing more and more scams. Here are 7 ways to avoid losing your money in such scams: Forex scams are becoming frequent. Michael Greenberg reports on luxurious expenses, including a submarine bought from the money taken from forex traders. Here’s another report of a forex fraud. So, how can we avoid falling in such forex scams?
What Are the 10 Fatal Mistakes Traders Make
Trading is exciting. Trading is hard. Trading is extremely hard. Some say that it takes more than 10,000 hours to master. Others believe that trading is the way to quick riches. They might be both wrong. What is important to know that no matter how experienced you are, mistakes will be part of the trading process.
The challenge: Timing the market and trader psychology
Successful trading often comes down to timing – entering and exiting trades at the right moments. Yet timing the market is notoriously difficult, largely because human psychology can derail even the best plans. Two powerful emotions in particular – fear and greed – tend to drive trading decisions off course.