Ever tried using Mercury Retrograde for market predictions?
Did it disappoint you with inconsistent results?
You’re not alone.
Many traders face similar frustrations. The aim here is not to give up but to use a better approach.
This guide will show you how to cut through the confusion.
We'll use Mercury Retrograde as a reliable trend reversal indicator, focusing on and forecasting the Nikkei and Nvidia for 2024.
Here's what you’ll learn
1. A quick overview of Mercury Retrograde and its market impact
2. Why most traders Struggle with Inconsistency
3. Introducing the Mercury Retrograde Framework
4. Real-life Trading Nikkei Example
5. Forecast: Nikkei & Nvidia
6. Conclusion: Trade with a New Lens
Ready to get started?
1. Understanding Mercury Retrograde
What's Mercury Retrograde?
Mercury Retrograde happens when Mercury appears to move backward in the sky. This occurs three to four times a year and lasts about three weeks.
People often link it to confusion, delays, and disruptions.
But how does it impact markets?
Impact on Markets:
Studies suggest Mercury Retrograde can cause market volatility.
Yet, the effect isn’t consistent.
Sometimes, markets rise; other times, they fall or move sideways. This makes it tricky to rely on Mercury's Retrograde for predictions.
2. Common challenges for traders
50-50 Results:
A significant issue is the sheer unpredictability. Post-Mercury Retrograde, the market’s direction is often a coin toss.
Misconceptions:
Most traders assume Mercury Retrograde causes uniform market reactions. This static view and the cosmos are a lot more complex. The astrological system works very dynamically, and the market does not have a static response to the same astrological configuration in the sky. In other words, the market sometimes gives you the same bullish or bearish signal every time Mercury retrogrades, but only some of the time.
One key misconception is the belief that Mercury retrogrades or similar astrological events, such as the new moon or Jupiter retrograde, act as isolated "ignitions" causing significant market movements. In reality, these events rarely move the market independently.
Profitability Concerns:
Attempts to hedge bets with a mix of long calls and puts often fall short, and high premiums eat into profits.
3. Introducing the Mercury Retrograde framework approach
Static vs Dynamic:
You are trying to find a simple rule: the market will rise or plummet whenever Mercury retrogrades or enters a specific range of longitude coordinates. It is too static. Instead, think of Mercury Retrograde as a cycle, not a trigger. This dynamic approach can help you see Mercury Retrograde with a New Lens and crack the code.
Adopting a dynamic framework is crucial to improving research on Mercury’s role as a trend reversal indicator.
4. Real-life examples and charts: Nikkei, August 4-27, 2024
Step 1: Mark the Retrograde Period on Your Chart
Step 2: Add Layers to Your Strategy
To get the most out of the Mercury Retrograde framework, you can always combine it with WD Gann’s Mathematical Indicators:
- Repeat Energy Indicator: Place buy orders when you see a repeating energy pattern forming.
- Dark Energy: The Repeat Energy pattern can also help calculate Dark Energy, where the price won’t touch the chart. This helps keep a tight stop-loss in place.
- VSE Indicator: The VSE is designed explicitly for sideways markets. If you missed the reversal on September 1, you could still re-enter at 38,442 using the VSE indicator.

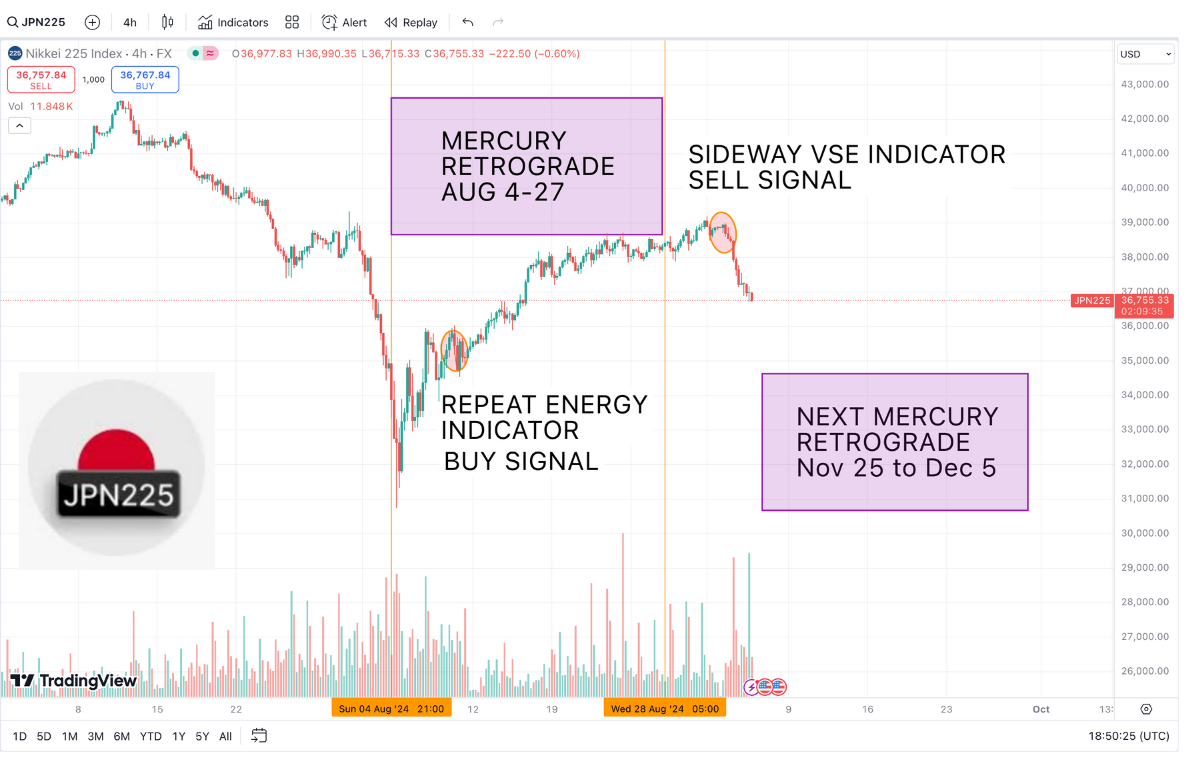
Combining these tools gives you a clearer picture of market behavior and more profits.
Using the Mercury Retrograde framework is a unique way to predict market reversals. When viewed through the right lens, it can be used to spot other markets where Mercury Retrograde plays a role, such as Nvidia.
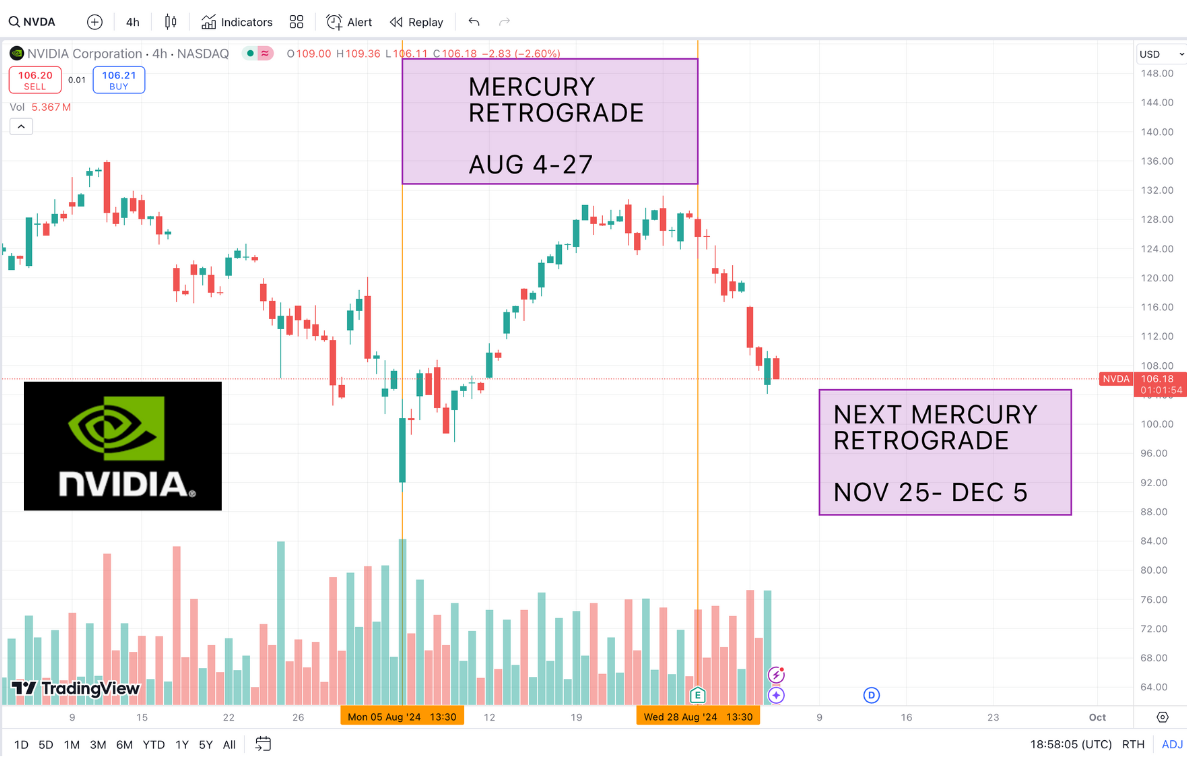
5. 2024 forecast: Nikkei and Nvidia trends to watch in 2024
Keep an eye on the upcoming Mercury Retrograde from November 25 to December 15, 2024. Once you get a handle on the Mercury Retrograde Framework, you’ll know exactly what to do in the next retrograde.
Here's a hint: the energy of the Mercury Retrograde Framework driving price action works like a team rowing a boat.
Don’t rely on astrology software to give you the percentage accuracy for Mercury Retrograde based on backtesting to reverse next time. It’s about reading what is happening in the market at the moment. That’s what I mean by trading with a new lens.
6. Conclusion: Trade with a new lens
Always be open to learning. When you start seeing the market through a new lens, you can screen the markets affected by Mercury Retrograde and turn them into profitable indicators.
Stay proactive, keep growing, and happy trading!
Khit Wong and all members of Gann Explained LLC are NOT financial advisors, and nothing they say is meant to be a recommendation to buy or sell any financial instrument. All information is strictly educational and/or opinion. By reading this, you agree to all of the following: You understand this to be an expression of opinions and not professional advice. Any opinions, news, research, analysis, prices, or other information contained on this website is provided as general market commentary and education and does not constitute advice. The brand name of Gann Explained LLC will not accept liability for any loss or damage, including without limitation any loss of profit, which may arise directly or indirectly from the use of or reliance on such information. You are solely responsible for the use of any content and hold Khit Wong, Gann Explained LLC all members harmless in any event or claim. FTC DISCLOSURE: Any income claims shared by myself, students, friends, or clients are understood to be true and accurate but are not verified in any way. Always do your own due diligence and use your own judgment when making buying decisions and investments in your business.
Editors’ Picks
GBP/USD stays depressed below 1.3150 after UK CPI inflation data
GBP/USD keeps its downbeat tone intact below 1.3150 in European trading on Wednesday. The UK annual Consumer Price Index (CPI) inflation declined to 3.6% in October, as expected, fanning expectations of a BoE rate cut in December. The focus now shifts to the mid-tier US data and Fed Minutes.
EUR/USD hovers below 1.1600, awaits Fed Minutes
EUR/USD flat lines after three days of losses, trading below 1.1600 in the European trading hours on Wednesday. The pair tracks the subdued price action in the US Dollar. Traders turn cautious and opt to stay on the sidelines ahead of the Minutes of the Fed's October monetary policy meeting.
Gold climbs to $4,100 neighborhood; eyes weekly high ahead of FOMC minutes
Gold builds on the previous day's recovery from levels just below the $4,000 psychological mark, or a one-and-a-half-week low, and gains positive traction for the second straight day. The momentum lifts the bullion to the top end of its weekly range, with bulls now awaiting a sustained move beyond the $4,100 round figure before positioning for further gains as the focus remains on FOMC minutes.
Cronos Price Prediction: CRO nears wedge pattern playout, bulls in focus
Cronos (CRO) ticks lower by 3% at press time on Wednesday, retreating after a 10% surge from the previous day. The short-term fluctuations approach the apex of a falling wedge pattern, which typically results in an upside breakout.
UK inflation boosts chance for rate cut, as risk finally stabilizes
UK inflation cooled as expected last month, headline inflation moderated to 3.6% from 3.8%, the core rate also dropped a notch to 3.4% from 3.5% in September, and service price inflation also moderated to 4.5%, down from 4.7%.
RECOMMENDED LESSONS
Making money in forex is easy if you know how the bankers trade!
I’m often mystified in my educational forex articles why so many traders struggle to make consistent money out of forex trading. The answer has more to do with what they don’t know than what they do know. After working in investment banks for 20 years many of which were as a Chief trader its second knowledge how to extract cash out of the market.
5 Forex News Events You Need To Know
In the fast moving world of currency markets where huge moves can seemingly come from nowhere, it is extremely important for new traders to learn about the various economic indicators and forex news events and releases that shape the markets. Indeed, quickly getting a handle on which data to look out for, what it means, and how to trade it can see new traders quickly become far more profitable and sets up the road to long term success.
Top 10 Chart Patterns Every Trader Should Know
Chart patterns are one of the most effective trading tools for a trader. They are pure price-action, and form on the basis of underlying buying and selling pressure. Chart patterns have a proven track-record, and traders use them to identify continuation or reversal signals, to open positions and identify price targets.
7 Ways to Avoid Forex Scams
The forex industry is recently seeing more and more scams. Here are 7 ways to avoid losing your money in such scams: Forex scams are becoming frequent. Michael Greenberg reports on luxurious expenses, including a submarine bought from the money taken from forex traders. Here’s another report of a forex fraud. So, how can we avoid falling in such forex scams?
What Are the 10 Fatal Mistakes Traders Make
Trading is exciting. Trading is hard. Trading is extremely hard. Some say that it takes more than 10,000 hours to master. Others believe that trading is the way to quick riches. They might be both wrong. What is important to know that no matter how experienced you are, mistakes will be part of the trading process.
The challenge: Timing the market and trader psychology
Successful trading often comes down to timing – entering and exiting trades at the right moments. Yet timing the market is notoriously difficult, largely because human psychology can derail even the best plans. Two powerful emotions in particular – fear and greed – tend to drive trading decisions off course.
