How To Pick Stocks To Invest In – Fundamental vs Technical Analysis [Video]
![How To Pick Stocks To Invest In – Fundamental vs Technical Analysis [Video]](https://editorial.fxstreet.com/images/Markets/Equities/display-panel-of-daily-stock-market-59908972.jpg)
How To Pick Stocks To Invest In
So you decided to invest in stocks.
That’s great!
Here’s the problem:
There are approx. 6,500 stocks traded at the New York Stock Exchange (NYSE) and another 3,500 stocks are traded on NASDAQ.
That’s a total of 10,000 stocks!
When I was new to trading, I didn’t know how to pick stocks to invest in.
Should you subscribe to a newsletter?
Or listen to the talking heads on TV?
Or should you try to develop your own trading system?
How Do You Decide What Stocks To Buy?
There are mainly 2 ways to pick stocks to invest in:
- Fundamental Analysis and
- Technical Analysis
In this article, I will explain both approaches and answer the question:
“Which is better: Fundamental Analysis or Technical Analysis?”
Let’s get started!
What Is Fundamental Analysis?
Here’s how to pick stocks to invest in using fundamental analysis:
Fundamental analysis means that you are analyzing the company’s “key performance indicators (KPIs)” to determine the true value of a company.
The most common used KPIs are:
- Revenue
- Profit
- Earnings per Share (EPS)
- Price to Earnings Ratio (PE Ratio)
- Market cap
… and many others.
In addition, you need to consider some other factors when using fundamental analysis to determine the fair value of a company, such as…
- The business model
- The competitive advantage
- The management team
- National or global opportunities and threats
… and the list goes on.
If you’re right now confused or feel overwhelmed – you’re not alone.
That’s why many investors listen to “analysts” on TV like Jim Cramer or Rick Santelli, just to name a few.
Or they rely on newsletters to pick stocks to invest in. The idea is that somebody else who is supposedly smarter is doing the analysis for them.
Here’s the problem with fundamental analysis:
YES, there are some formulas on how to calculate the “hard data” e.g. Earnings Per Share and the PE ratio.
But when it comes to other factors like the business model, opportunities and threats, everybody has a different opinion. And who decides which “opinion” is right? Only the market will tell.
And that’s why fundamental analysis is very difficult – and inaccurate.
Often the time horizon for fundamental analysis is YEARS – for a reason: If you wait long enough, eventually you will be right!
Here’s an example:
Below is a chart of Tesla (TSLA)
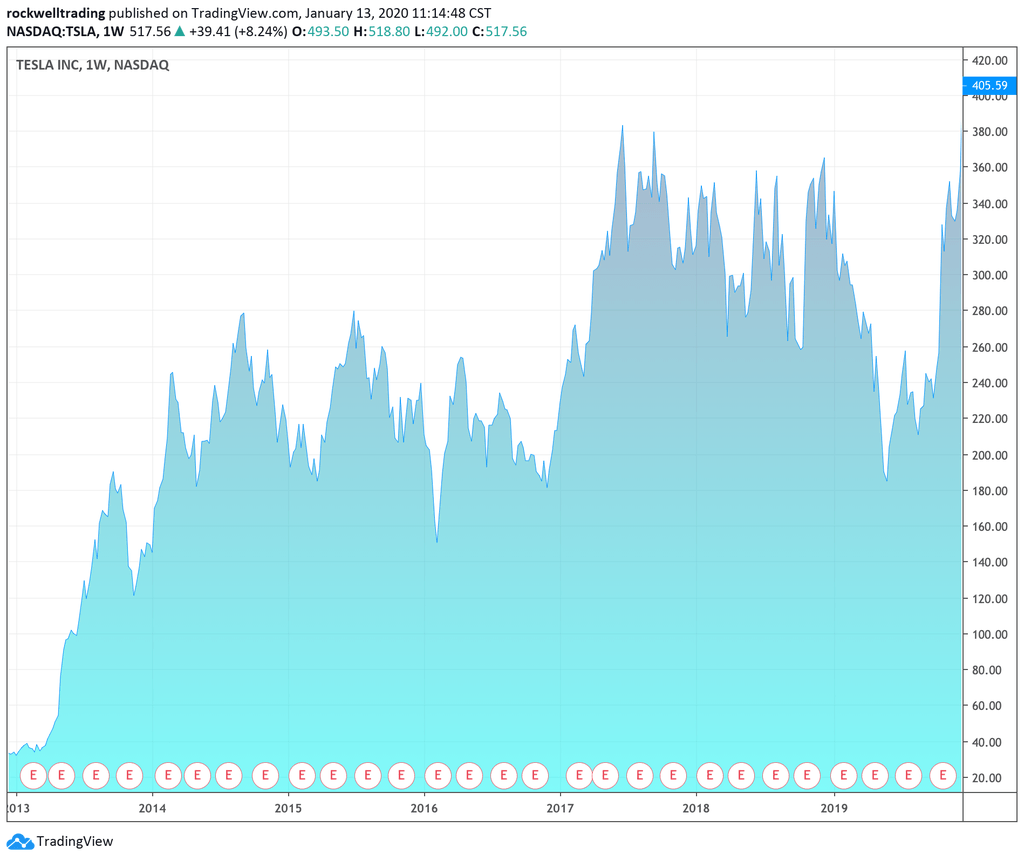
As you can see, TSLA has been trading between $100 and $350 for the past 5 years.
There are many critics, who say that Tesla’s business model and management style doesn’t work. They are criticizing the CEO Elon Musk.
And when the stock went from $360 to $180 within a few months, they said: “See? We’re right!”
On the other hand, you have “analysts” who are bullish on Tesla. They love what the company does!
And when the stock bounced back from $180 to over $400, they said: “See? We’re right!”
As you can see, BOTH of them were right. If you wait long enough, most analysts will eventually be right.
But in my opinion, this is too vague to make money with it.
So let’s take a look at “technical analysis” now:
What Is Technical Analysis?
Technical analysts use charts and past price movements to predict the next move of a stock.
Here’s how to pick stocks to invest in using technical analysis.
When using technical analysis, there are two main approaches:
- Chart Patterns and
- Indicators
Let’s talk about chart patterns first.
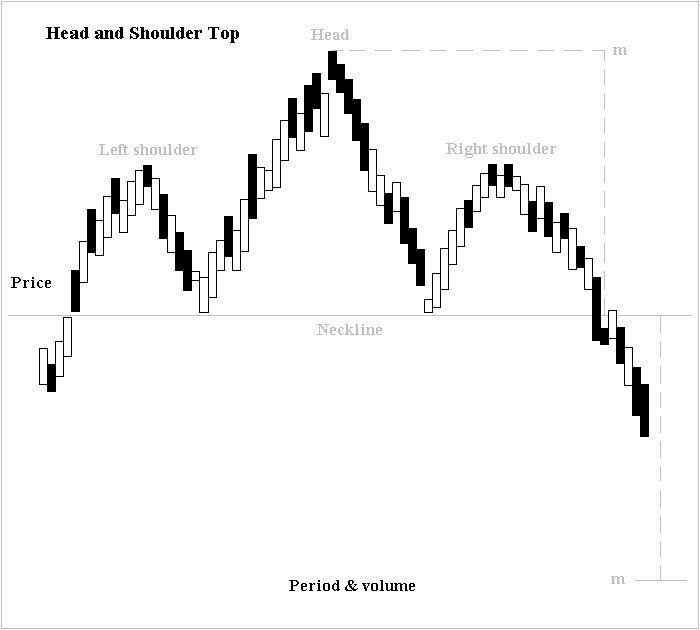
The most popular chart pattern is a so-called “head and shoulder formation.”
Here’s an example:
There are many others:
- Flags
- Pennants
- Triangle
- Cup and Handle
- Double tops and bottoms
… just to name a few.
Here’s my problem with chart patterns:
I see them in hindsight, but NOT while they are forming!
If you show me a chart right now, I can show you every single chart pattern that occurred in the past. But I could not tell you what chart pattern is forming right now, because there’s a lot of room for interpretation.
So what’s the solution?
I personally like indicators!
One of the most popular trading indicators is a moving average.
Here’s an example:
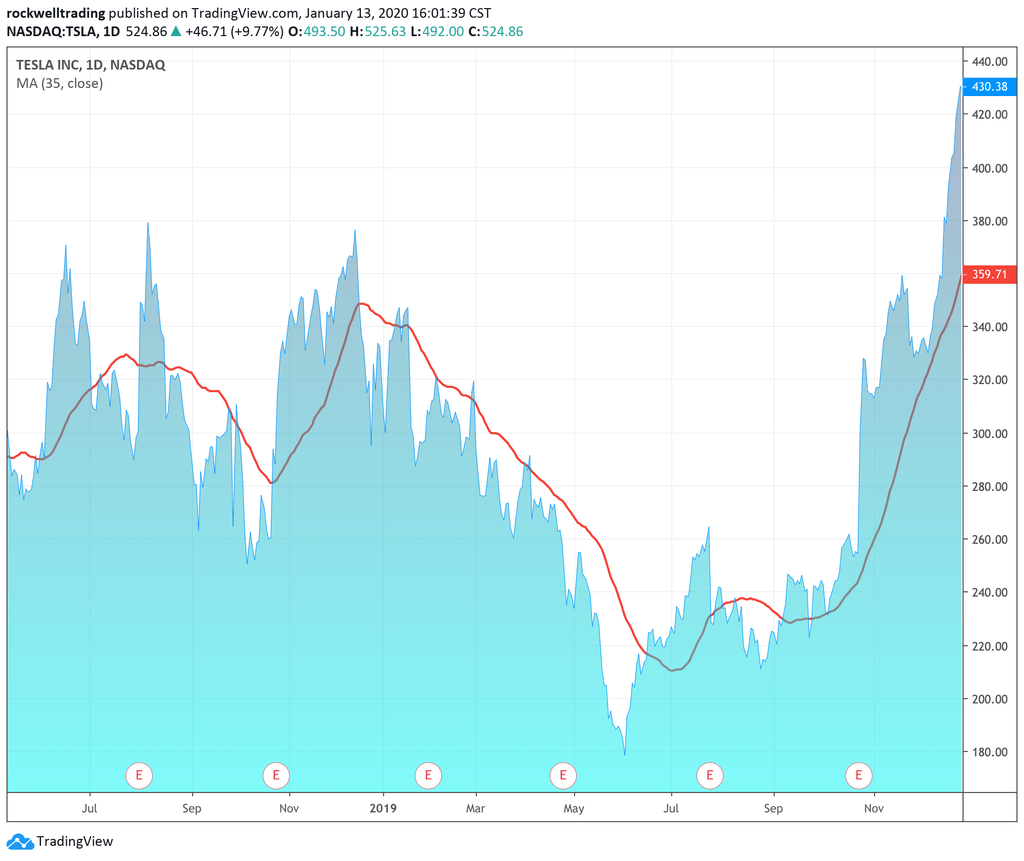
The red line is a Moving Average.
The idea is that prices are more likely to go up when they remain ABOVE the moving average and that prices are more likely to go down when they are BELOW the moving average.
Of course, this example is very simple. There are dozens of indicators, and based on my experience, there’s no such thing as a “best” indicator.
I personally found that a combination of THREE indicators is very powerful, and I’ll tell you more about this in a minute.
What Is The Difference Between Fundamental And Technical Analysis?
When using fundamental analysis, you have to dig through balance sheets, profit and loss statements and analyze the cash flow and assets of a company.
In addition, you have to look at the business model, the competitive advantage, the management team as well as national or global opportunities and threats.
As you can see, fundamental analysis is difficult and time-consuming.
And it leaves a lot of room for interpretation.
Therefore, it’s almost impossible for the private trader to conduct a thorough financial analysis to pick the best stock to invest in.
On the other hand, technical analysis is quite easy, because these days, every charting software has already all indicators available to you.
So you can use technical analysis to pick the right stock in a matter of hours!
What Is Better: Fundamental Or Technical Analysis
How to pick stocks to invest in?
Should you use fundamental analysis or technical analysis?
For me, technical analysis is way easier than fundamental analysis.
I love indicators, and here’s why:
- Indicators are scientific and based on statistical analysis.
- They are easy to understand and use.
- They are “black and white.” Either the prices are below the moving average or they are above. You don’t have to guess.
- You can use indicators without any prior experience. It’s perfect for beginners.
- And the best: These days, you have powerful software packages that do the work for you!
Now you know the different ways how to pick stocks to invest in. And you know the difference between fundamental analysis vs. technical analysis.
And you know which one is better.
Next steps: Check out my video and then try to for yourself.
You’re going to love it!
Author

Markus Heitkoetter
Rockwell Trading
As founder and CEO of Rockwell Trading Services LLC., Markus Heitkoetter has shared his trading methods and ideas with more than 300,000 traders in over 196 countries.


