Check out the following trade write-up for an excellent ratio of:
-
Sensible risk mangement.
-
Achievable workload.
-
Satisfying outcomes.
Now:
Using a trip in your car as an analogy...
You don't reach your destination by knowing how to drive. You reach it by knowing where you're going.
The same applies to trading
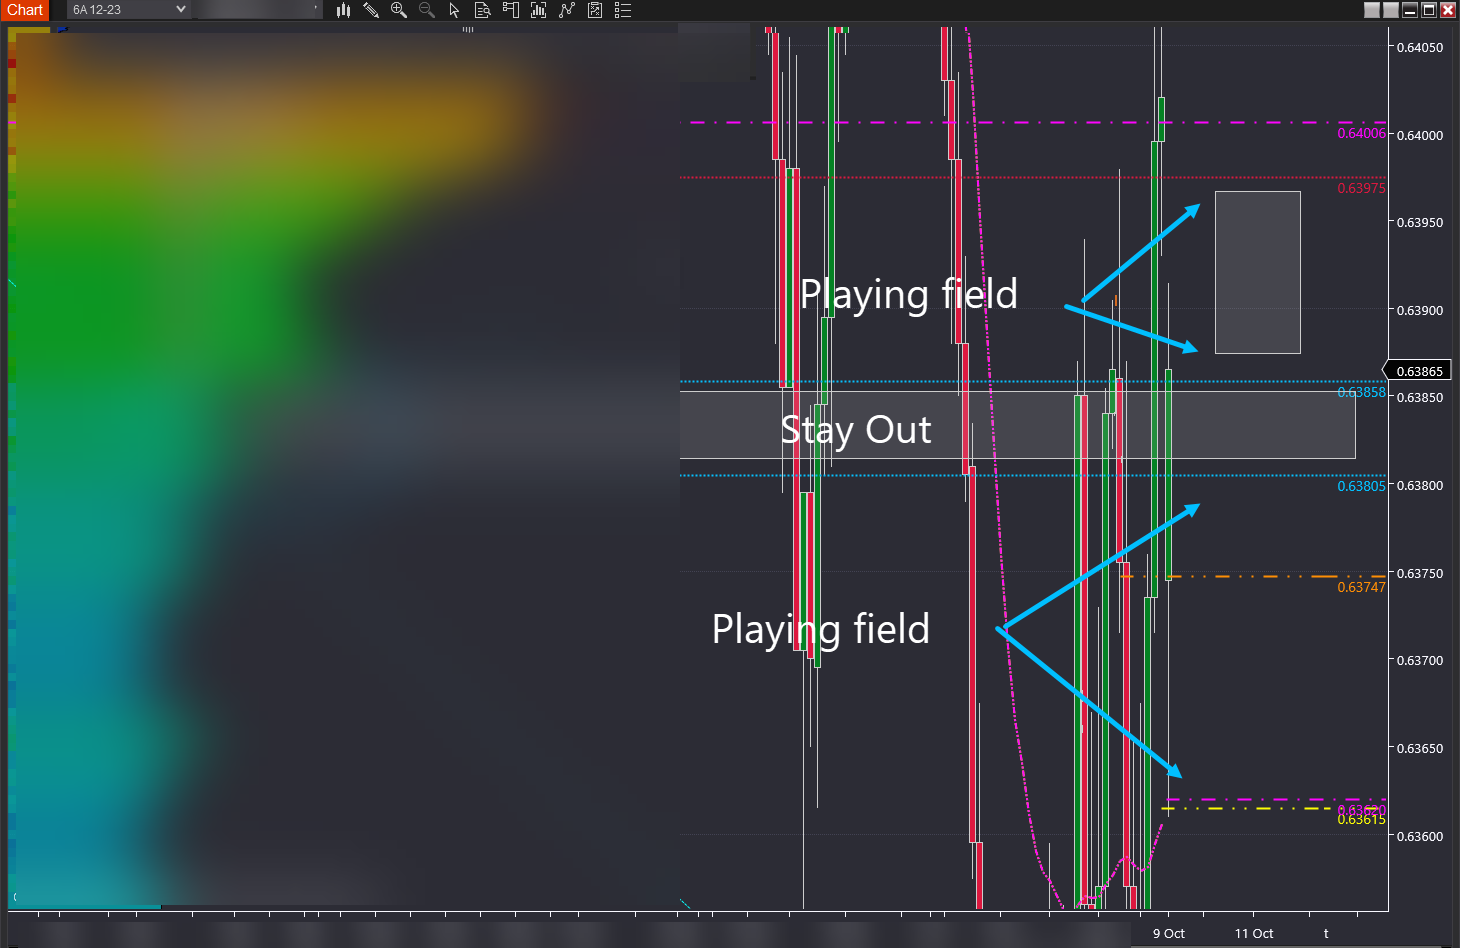
The chart below provides a map of where you can trade and where you can't - as represented by the areas marked 'playing fields'.
Contrary to popular understanding:
The money is made before a trade is placed - making the game plan a critical success component. You'll see how in a minute.
But first
When driving your car, interruptions such as road works and detours are common. Fortunately, modern apps tell us of pending delays so we can plan accordingly.
Likewise:
A host of pending interruptions to price movement can be accounted for during the game-planning phase.
Below you can see one such potential interruption within the upper playing field.
As price moves up it will reach the arrowed line where a large group of sellers previously hit the bid. When price reaches this level:
-
Could it lead to a complete reversal?
-
Or could the reversal be temporary?
Looking at the trading within this playing field:
-
Blue arrows are buys.
-
Pink arrows represent profit taking.

What do you see?
-
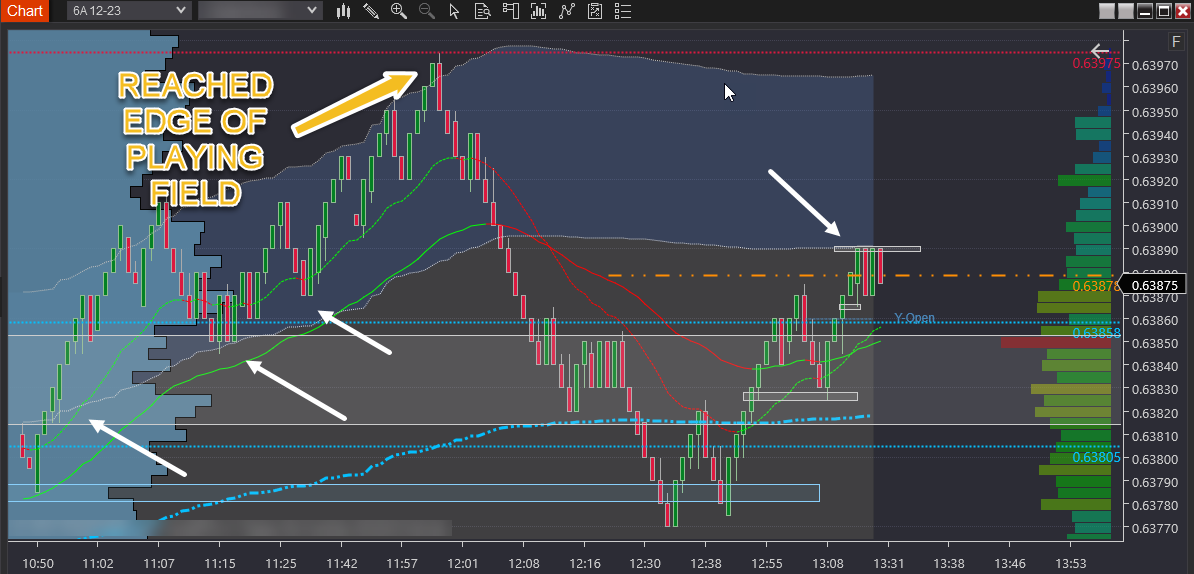
You can see trading occurs within the playing field shown in the first chart.
-
You also see the exiting (pink circle) after hitting the first interruption.
-
The interruption is temporary, and the trading is resumed.
-
Buying, adding, and taking profits continues until reaching the playing field boundary at 0.6397.
The power of the playing field
You'll see in second:
The boundary at 0.6397 marked the top of the move.
But if you look at the first chart - it's not 'prior highs' or 'price resistance'.
It's a unique calculation that leads to superior performance because the crowd is either:
-
Unaware of the relationship between price and relative value.
-
Or they lack the expertise to identify the correct value.
Satisfying outcomes relies on correctly identifying playing field boundaries.
How many trades was that?
While there were several buying and selling transactions - they were all part of a single trade idea which lasted about 50 mins.
From a workload perspective - it's not daunting to make the number of trades you see spread out over nearly an hour. Agree?
What happens next?
The following chart view shows the price running down after reaching the upper playing field boundary.
Guess what?
No trades were taken shorting the move down.
And that's because not all movement is opportunity...
-
The first half of the move down was too fast (for me) to trade - meaning it moved at a pace beyond my skill level.
-
And the second half moved into an area clearly marked on the game plan as "stay out" (see first chart).
But here's where it gets interesting:
Many people are seeing the move down as a long opportunity because:
-
Zoom out and you see a market trending upwards.
-
The market clearly didn't reach prior highs or 'resistance' levels.
-
Therefore price merely had a pullback and now is continuing up - or so it seems...
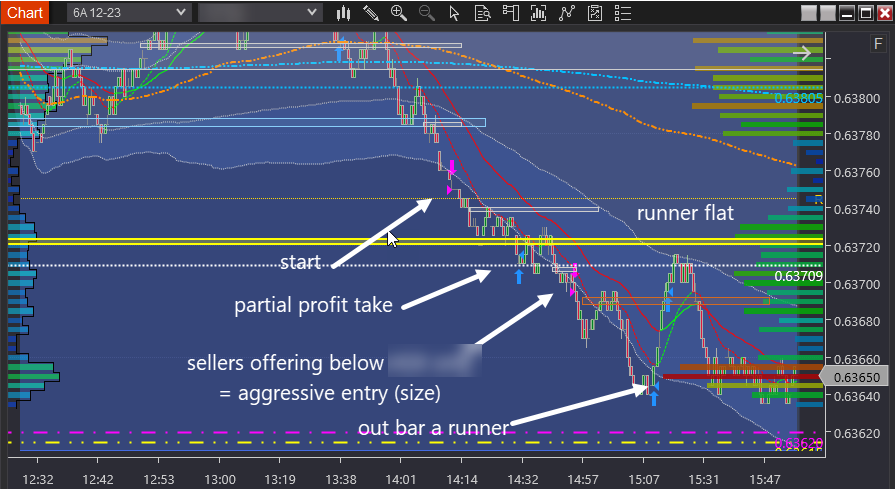
Below you can see attempts to fade the move to the upside aka trading against the current direction.
Caveat:
Fading is more challenging. You can see the first attempt was a loss. Followed a subsequent attempt which was profitable.

But more importantly:
Several proprietary observations concerning relative value (orange line) provided the context to enter short.
You also see price traded into the 'stay out' zone as marked on the very first chart.
'Stay out' areas are not intended for opening new trades.
Yet holding part of an existing position that trades into the area is fine.
Some profits were taken at the edge of 'stay out' and the balance at the next playing field boundary.
FYI: The entire sequence of trades (5 transactions) lasted 10 minutes.
Then what happens?
Finally:
Price moves into the lower playing field.
But what makes this playing field different to the earlier playing field is its suitability for adding to your winners.
You see:
A large problem facing traders is knowing when to add to winners and when not to add to winners. Agree?
And I should know...
It's something I struggled with for nearly three years. Intellectually I knew the next step in my trading was to add to my winners. But when I did - I turned the winning trade into an overall breakeven or worse, a losing trade. Sound familiar?
But for every trading problem, there's a solution. And without going into its origins, playing fields not only provide highly accurate guides to where price will reverse but also inform you of optimum areas for adding to winners.
In the following chart:
Annotations indicate adding to the trade.
Once again several executions contribute to a single trading idea. The entire sequence of trading lasts for about an hour.
Are you seeing a pattern?
From start to finish the session you're trading is about 5 hours duration.
You can trade more than one session (eg Asia plus maybe half of London) if you want to - or not.
Typically you will have prepared 2-3 trade ideas for a session.
Each idea might require 20-90 minutes of active management involving several executions.
In between managing those core trading ideas, you can:
-
Have a break
-
Take a couple of 'easy-money' scalps (for experienced traders only) should they arise
-
Review your game planning
-
Review your prior trades, including recording the periods where you traded.
But!
This is only achievable if you have enough context for a high-quality decision-making process - as demonstrated in the trading above.
And when you do - your trading resembles a manageable workload you can sustain year after year.
Forex and derivatives trading is a highly competitive and often extremely fast-paced environment. It only rewards individuals who attain the required level of skill and expertise to compete. Past performance is not indicative of future results. There is a substantial risk of loss to unskilled and inexperienced players. The high degree of leverage can work against you as well as for you. Before deciding to trade any such leveraged products you should carefully consider your investment objectives, level of experience, and risk appetite. The possibility exists that you could sustain a loss of some or all of your initial investment and therefore you should not invest money that you cannot afford to lose. You should be aware of all the risks associated with trading on margin, and seek advice from an independent
Editors’ Picks

EUR/USD eases toward 1.1700 as USD recovers
EUR/USD stays on the back foot and declines toward 1.1700 on Friday. The pair faces headwinds from a renewed uptick in the US Dollar as investors look past softer US inflation data. However, the EUR/USD downside appears capped by expectations of the Fed-ECB monetary policy divergence.

GBP/USD steadies below 1.3400 as traders assess BoE policy outlook
Following Thursday's volatile session, GBP/USD moves sideways below 1.3400 on Friday. Investors reassess the Bank of England's policy oıtlook after the MPC decided to cut the interest rate by 25 bps by a slim margin. Meanwhile, the US Dollar benefits from the cautious market stance, limiting the pair's upside.

USD/JPY rallies to near 157.00 as Yen plunges after BoJ’s policy outcome
The USD/JPY is up 0.85% to near 156.90 during the European trading session. The pair surges as the Japanese Yen underperforms across the board, following the Bank of Japan monetary policy announcement. In the policy meeting, the BoJ raised interest rates by 25 bps to 0.75%, as expected, the highest level seen in three decades.
Editors’ Picks
EUR/USD eases toward 1.1700 as USD recovers
EUR/USD stays on the back foot and declines toward 1.1700 on Friday. The pair faces headwinds from a renewed uptick in the US Dollar as investors look past softer US inflation data. However, the EUR/USD downside appears capped by expectations of the Fed-ECB monetary policy divergence.
USD/JPY rallies to near 157.00 as Yen plunges after BoJ’s policy outcome
The USD/JPY is up 0.85% to near 156.90 during the European trading session. The pair surges as the Japanese Yen underperforms across the board, following the Bank of Japan monetary policy announcement. In the policy meeting, the BoJ raised interest rates by 25 bps to 0.75%, as expected, the highest level seen in three decades.

Gold stays weak below $4,350 as USD bulls shrug off softer US CPI
Gold holds the previous day's late pullback from the vicinity of the record high and stays in the red below $4,350 in the European session on Friday. The US CPI report released on Thursday pointed to cooling inflationary pressures, but the US Dollar seems resilient amid a fresh bout of short-covering.

Bitcoin, Ethereum and Ripple correction slide as BoJ rate decision weighs on sentiment
Bitcoin, Ethereum, and Ripple are extending their correction phases after losing nearly 3%, 8%, and 10%, respectively, through Friday. The pullback phase is further strengthened as the upcoming Bank of Japan’s rate decision on Friday weighs on risk sentiment, with BTC breaking key support, ETH deepening weekly losses, and XRP sliding to multi-month lows.

How much can one month of soft inflation change the Fed’s mind?
One month of softer inflation data is rarely enough to shift Federal Reserve policy on its own, but in a market highly sensitive to every data point, even a single reading can reshape expectations. November’s inflation report offered a welcome sign of cooling price pressures.
RECOMMENDED LESSONS
Making money in forex is easy if you know how the bankers trade!
I’m often mystified in my educational forex articles why so many traders struggle to make consistent money out of forex trading. The answer has more to do with what they don’t know than what they do know. After working in investment banks for 20 years many of which were as a Chief trader its second knowledge how to extract cash out of the market.
5 Forex News Events You Need To Know
In the fast moving world of currency markets where huge moves can seemingly come from nowhere, it is extremely important for new traders to learn about the various economic indicators and forex news events and releases that shape the markets. Indeed, quickly getting a handle on which data to look out for, what it means, and how to trade it can see new traders quickly become far more profitable and sets up the road to long term success.
Top 10 Chart Patterns Every Trader Should Know
Chart patterns are one of the most effective trading tools for a trader. They are pure price-action, and form on the basis of underlying buying and selling pressure. Chart patterns have a proven track-record, and traders use them to identify continuation or reversal signals, to open positions and identify price targets.
7 Ways to Avoid Forex Scams
The forex industry is recently seeing more and more scams. Here are 7 ways to avoid losing your money in such scams: Forex scams are becoming frequent. Michael Greenberg reports on luxurious expenses, including a submarine bought from the money taken from forex traders. Here’s another report of a forex fraud. So, how can we avoid falling in such forex scams?
What Are the 10 Fatal Mistakes Traders Make
Trading is exciting. Trading is hard. Trading is extremely hard. Some say that it takes more than 10,000 hours to master. Others believe that trading is the way to quick riches. They might be both wrong. What is important to know that no matter how experienced you are, mistakes will be part of the trading process.
The challenge: Timing the market and trader psychology
Successful trading often comes down to timing – entering and exiting trades at the right moments. Yet timing the market is notoriously difficult, largely because human psychology can derail even the best plans. Two powerful emotions in particular – fear and greed – tend to drive trading decisions off course.