![]() Brandon Wendell, CMT
Brandon Wendell, CMT
Brandon Wendell
In my last article, we took a deep dive into the S&P 500 index to evaluate the signs and likelihood of a bear market. Today, we will examine the other equity market indexes to see if they are also indicating a bear market correction. There are four major stock market indexes in the United States, the S&P 500, the Nasdaq, the Russell 2000 and the Dow Jones Industrial Average. While they are all made up of stocks, each has their own individual characteristics due to the stocks that make them up.
The Nasdaq 100 index is an index that is comprised of the top 100 stocks listed on the Nasdaq exchange. As you can see below, the index is weighted heavily in the technology industry. The Dow Jones Industrial Average (the Dow), is one of the most popular indexes and most quoted in the world. It is interesting because it is made up of only 30 stocks. While many quote the Dow as a proxy for the American Economy, it is in fact a poor representation of it and is unevenly weighted.

The Russell 2000 index is made up of smaller companies that have most of their business dealings within the US. The weighting of the index is also more aligned with the economy of the US. The largest sector portion of the index, financials, is also the largest employer. This makes the Russell 2000 index a better barometer for measuring the health of the stock markets and the economy.
During the 2007 market crash, the Russell 2000 index peaked well before the other indexes. This relatively unfollowed index showed traders who were paying attention that the markets were worsening and that the new highs in October 2008 were not going to last.
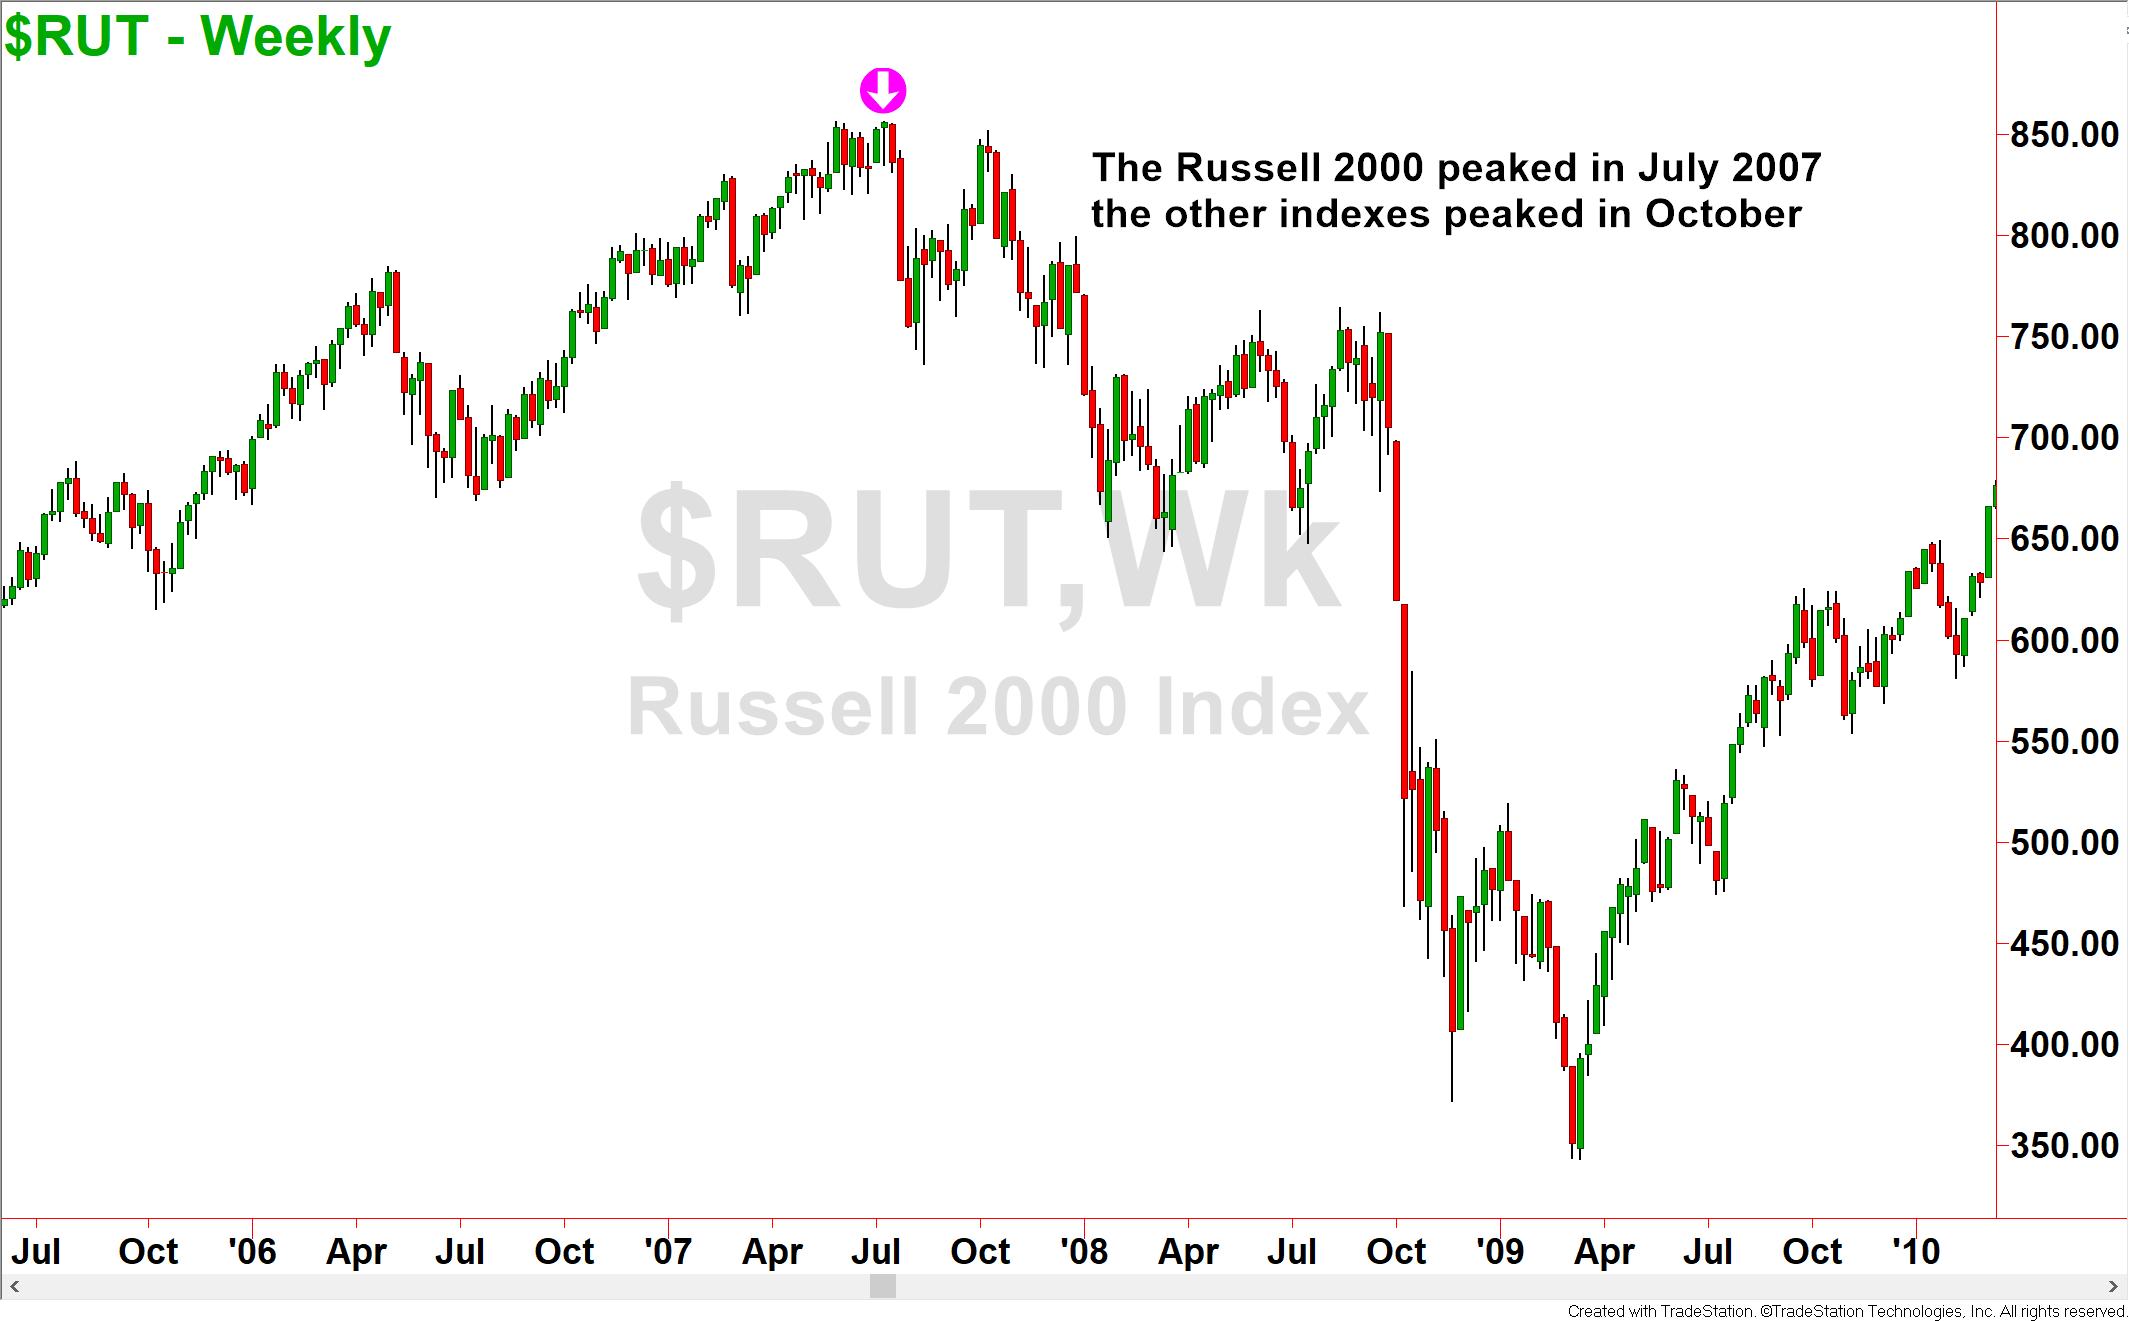
The same picture is happening today. The Russell 2000 index peaked in August 2018, before the peak of the other indexes in September. Since then, there was a drop in the index of over 27% from those highs. At the time of this writing, the Russell index is still down over 17% from the highs.

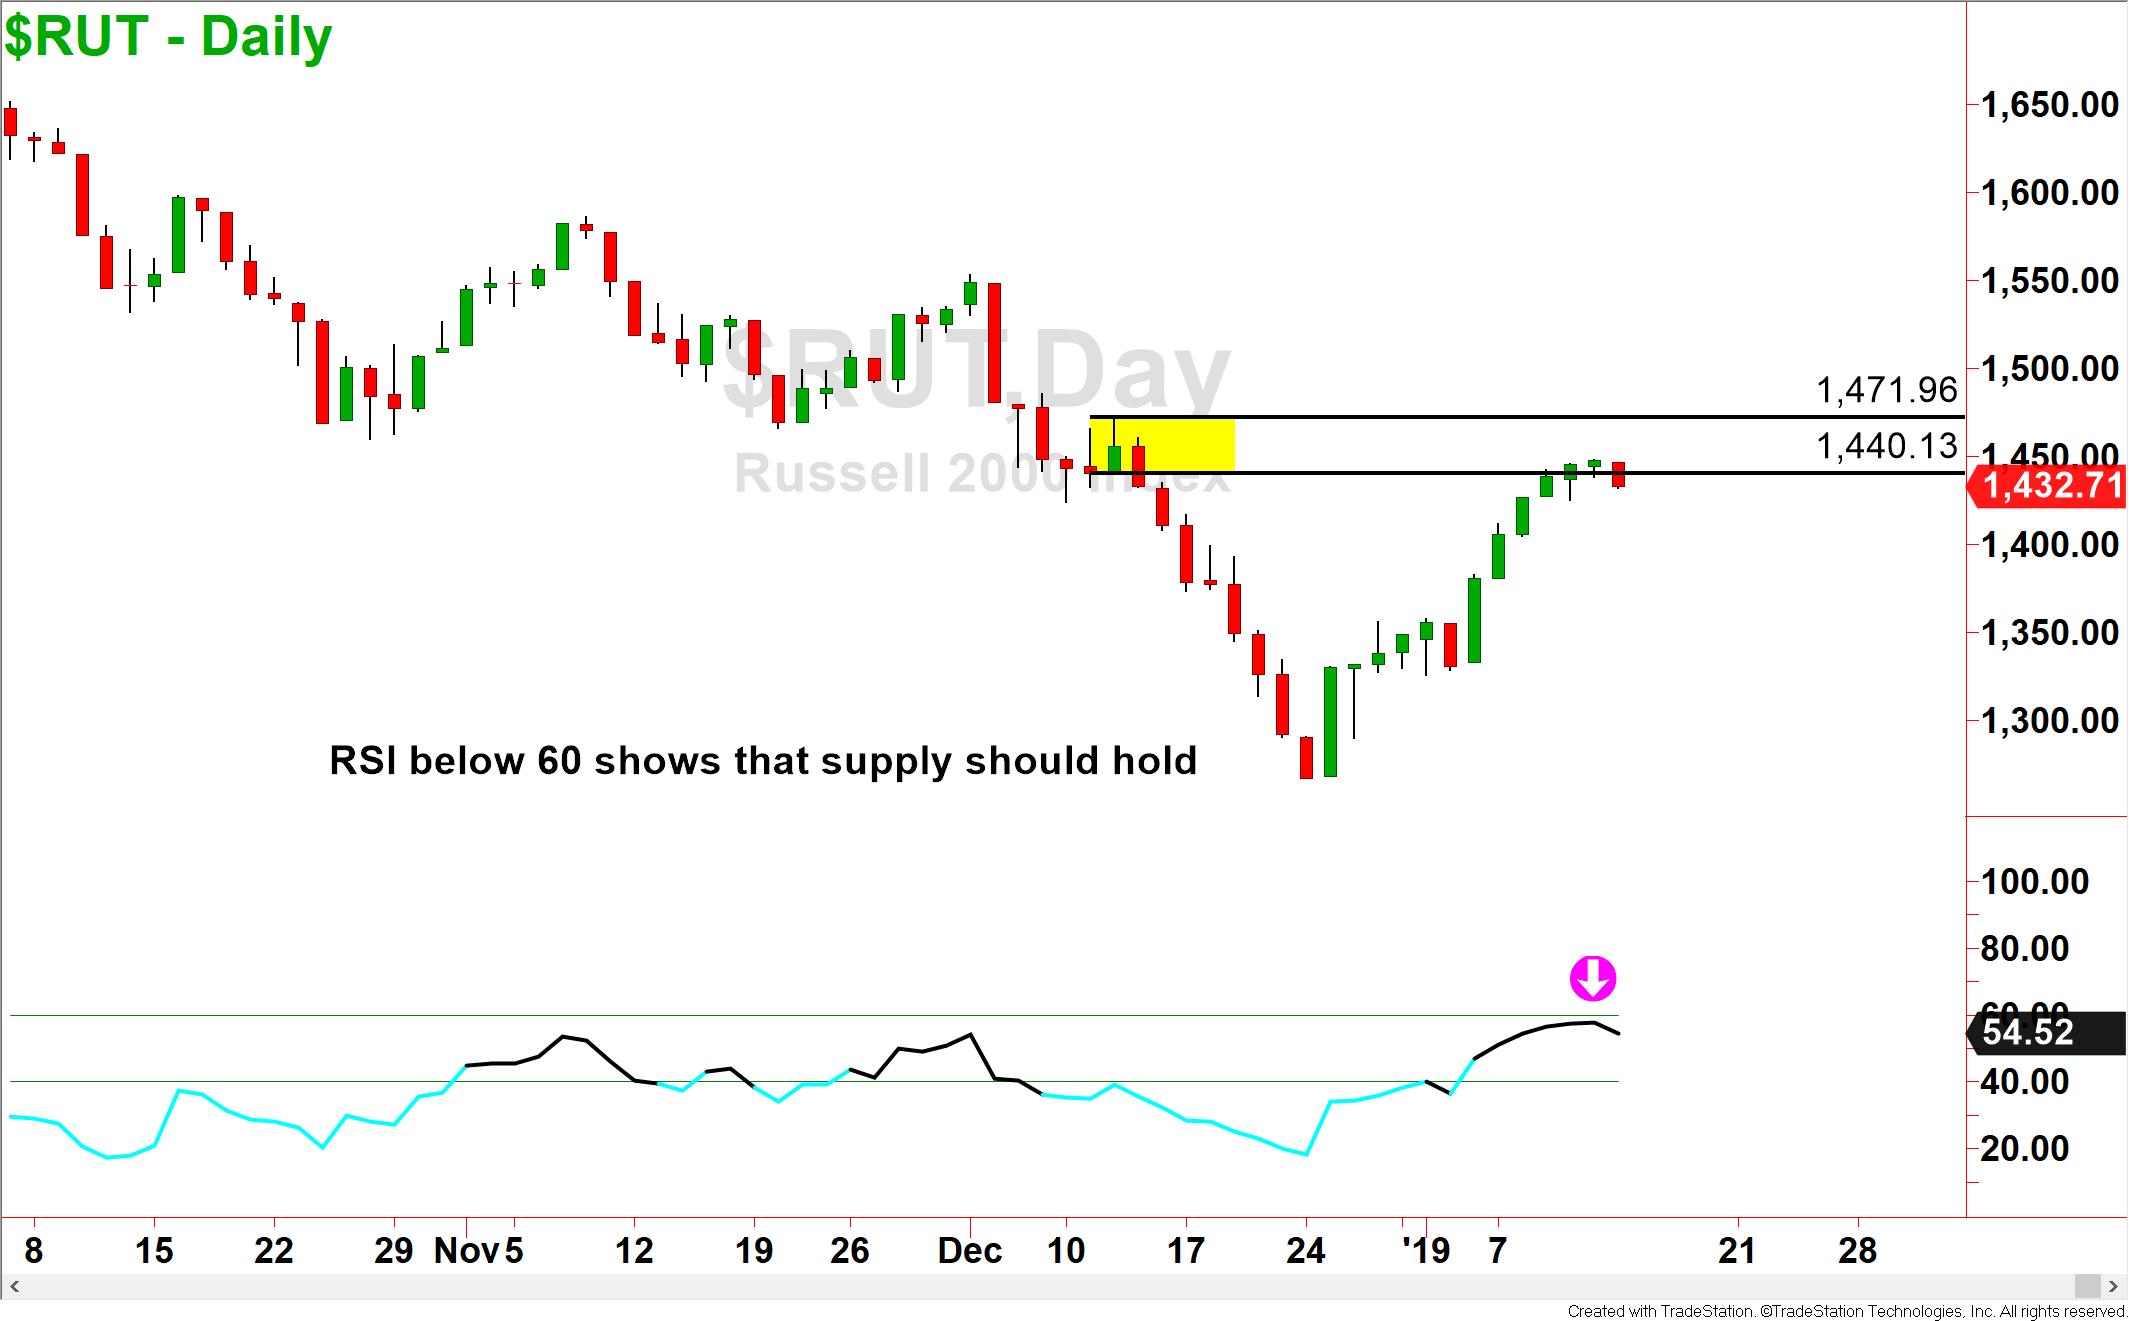
Looking at the daily picture of the Russell 2000, we are indeed seeing some bear market signals. Prices were hitting a daily supply zone on January 14th and it looked likely to continue its march downward. The momentum indicator shown on the chart verified that supply should hold, and lower prices are coming. This may lead the other market indexes lower as well.
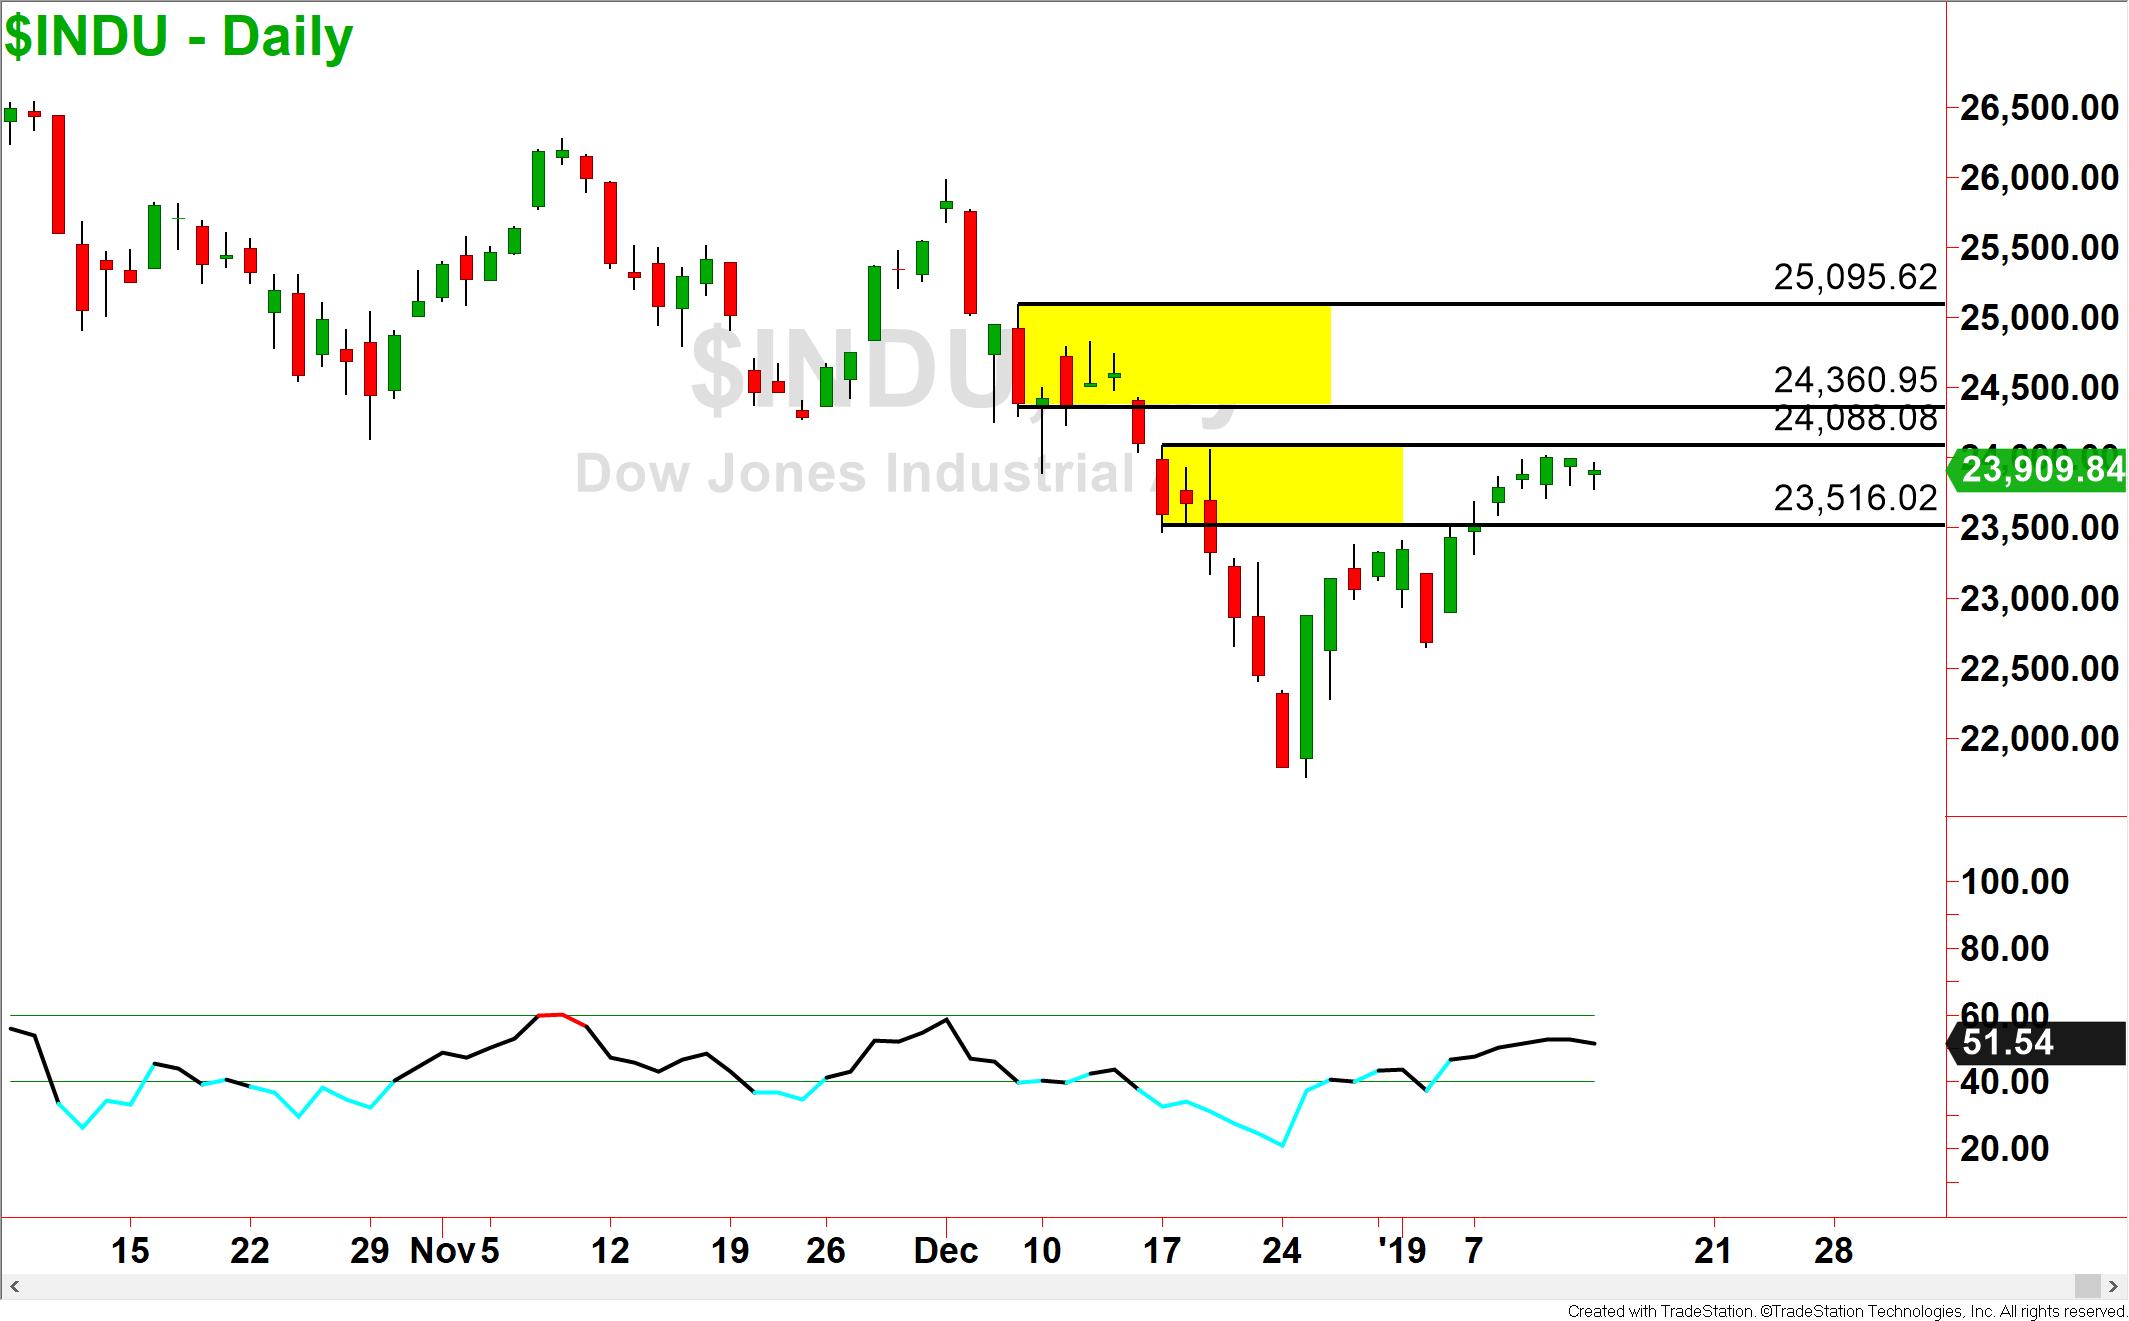
Looking at the big board, the Dow isn’t fairing much better. There was negative divergence that warned of prices turning down before the fall drop. The fact that the RSI cannot get above 60 on any of the market rallies is typical of a bearish environment. Add that to the fact that price has made lower highs and lower lows and you need to be protecting your retirement accounts.

The Dow is also in supply on the daily chart and looks to be headed for lower prices soon.
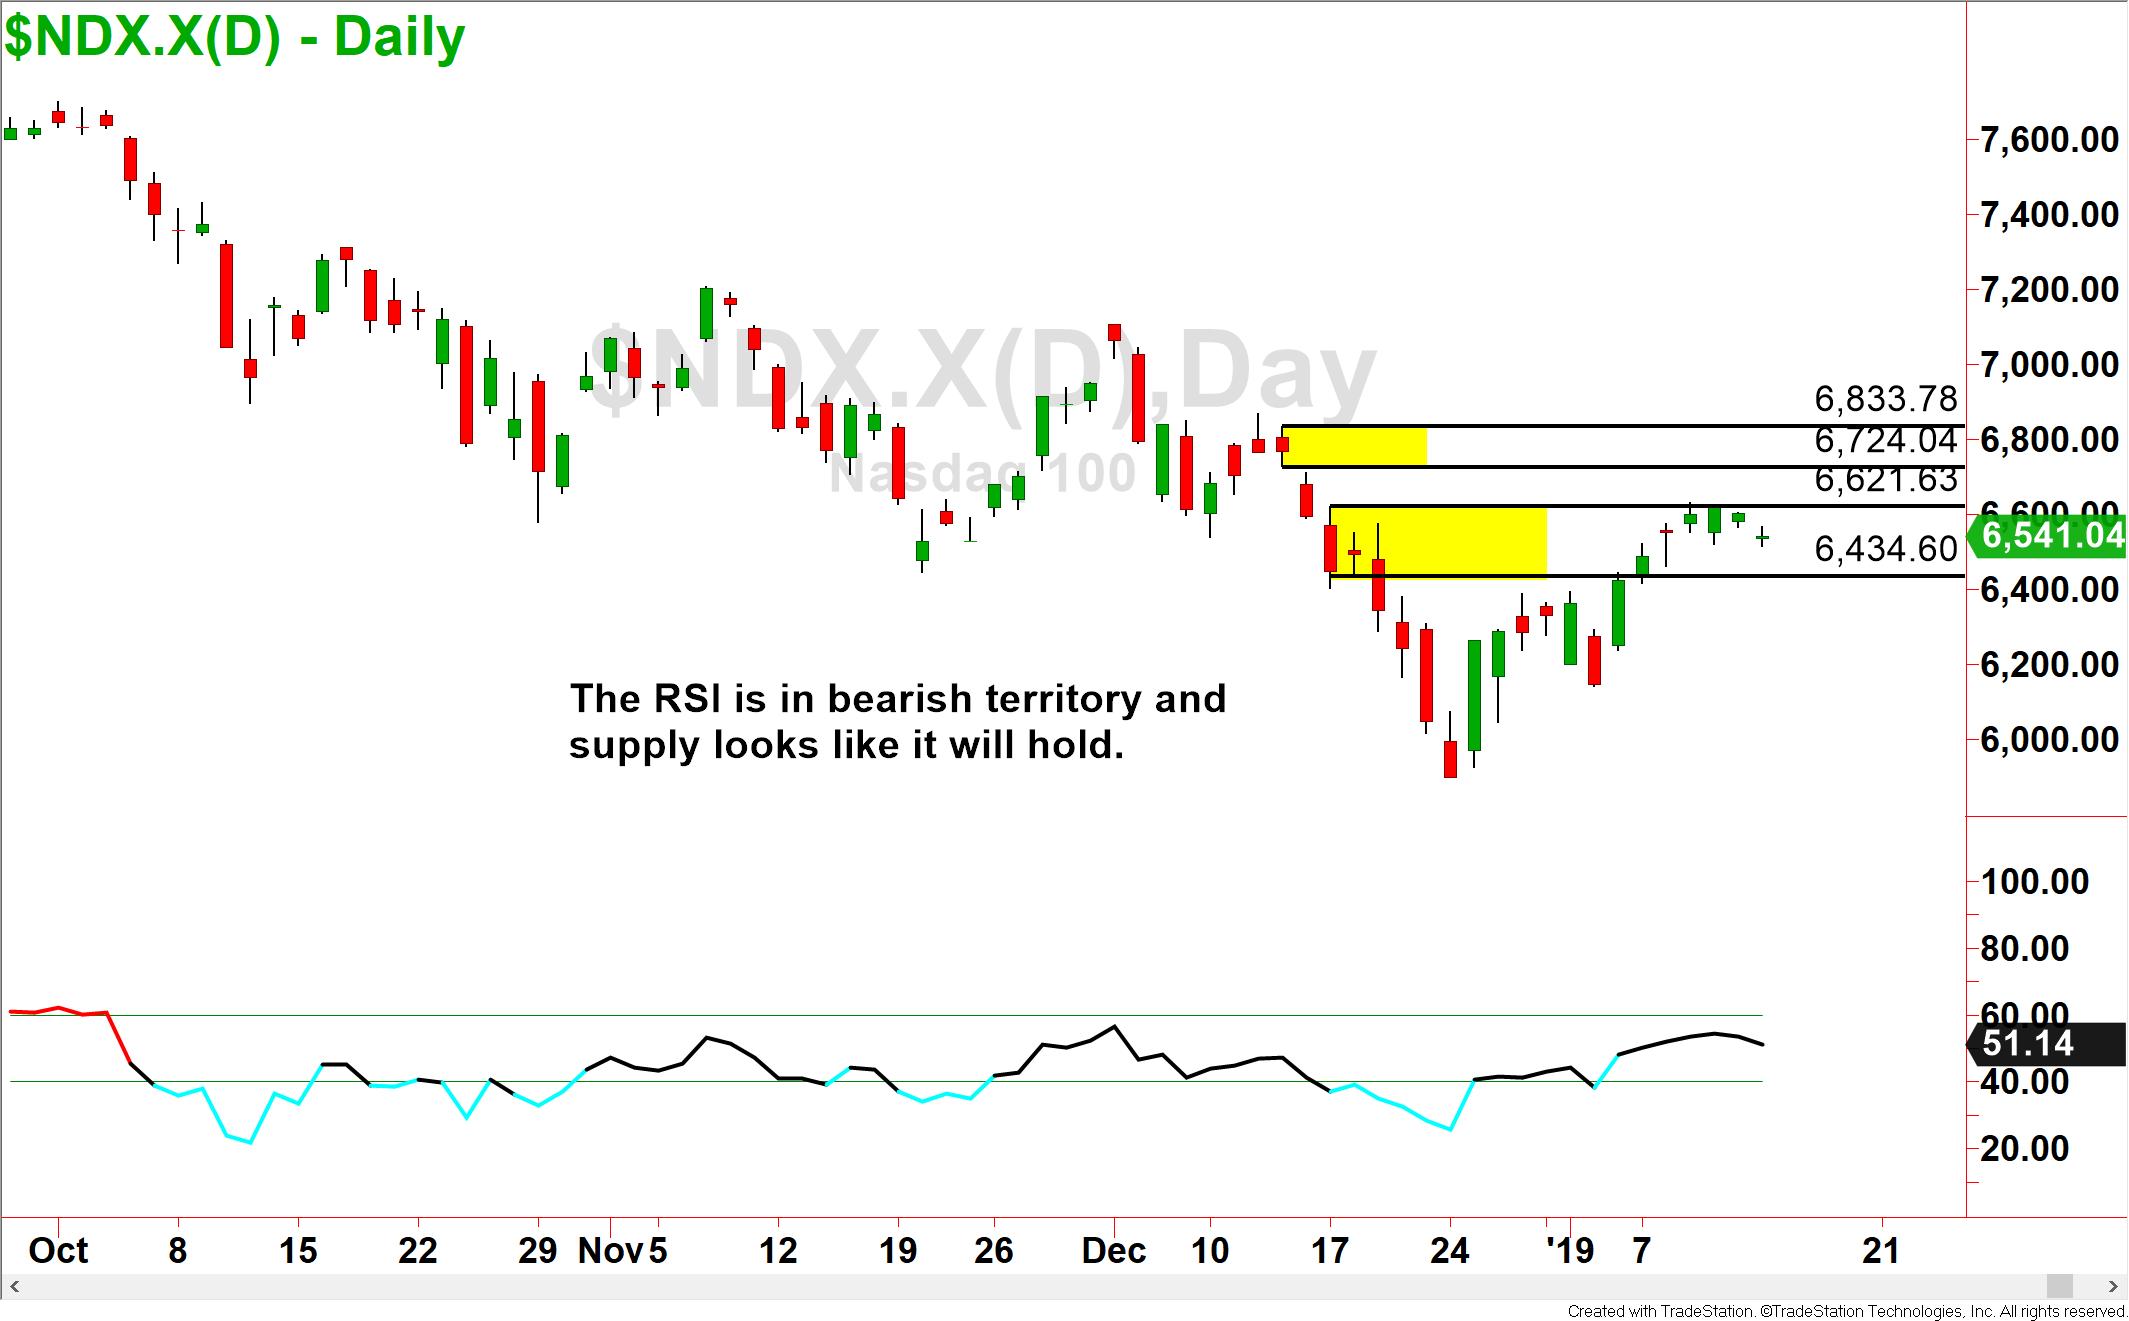
The tech heavy Nasdaq 100 has not been spared from this selling pressure. As with the other indexes, there was a divergence on the indicators which hinted at price weakness before the drop late last year.
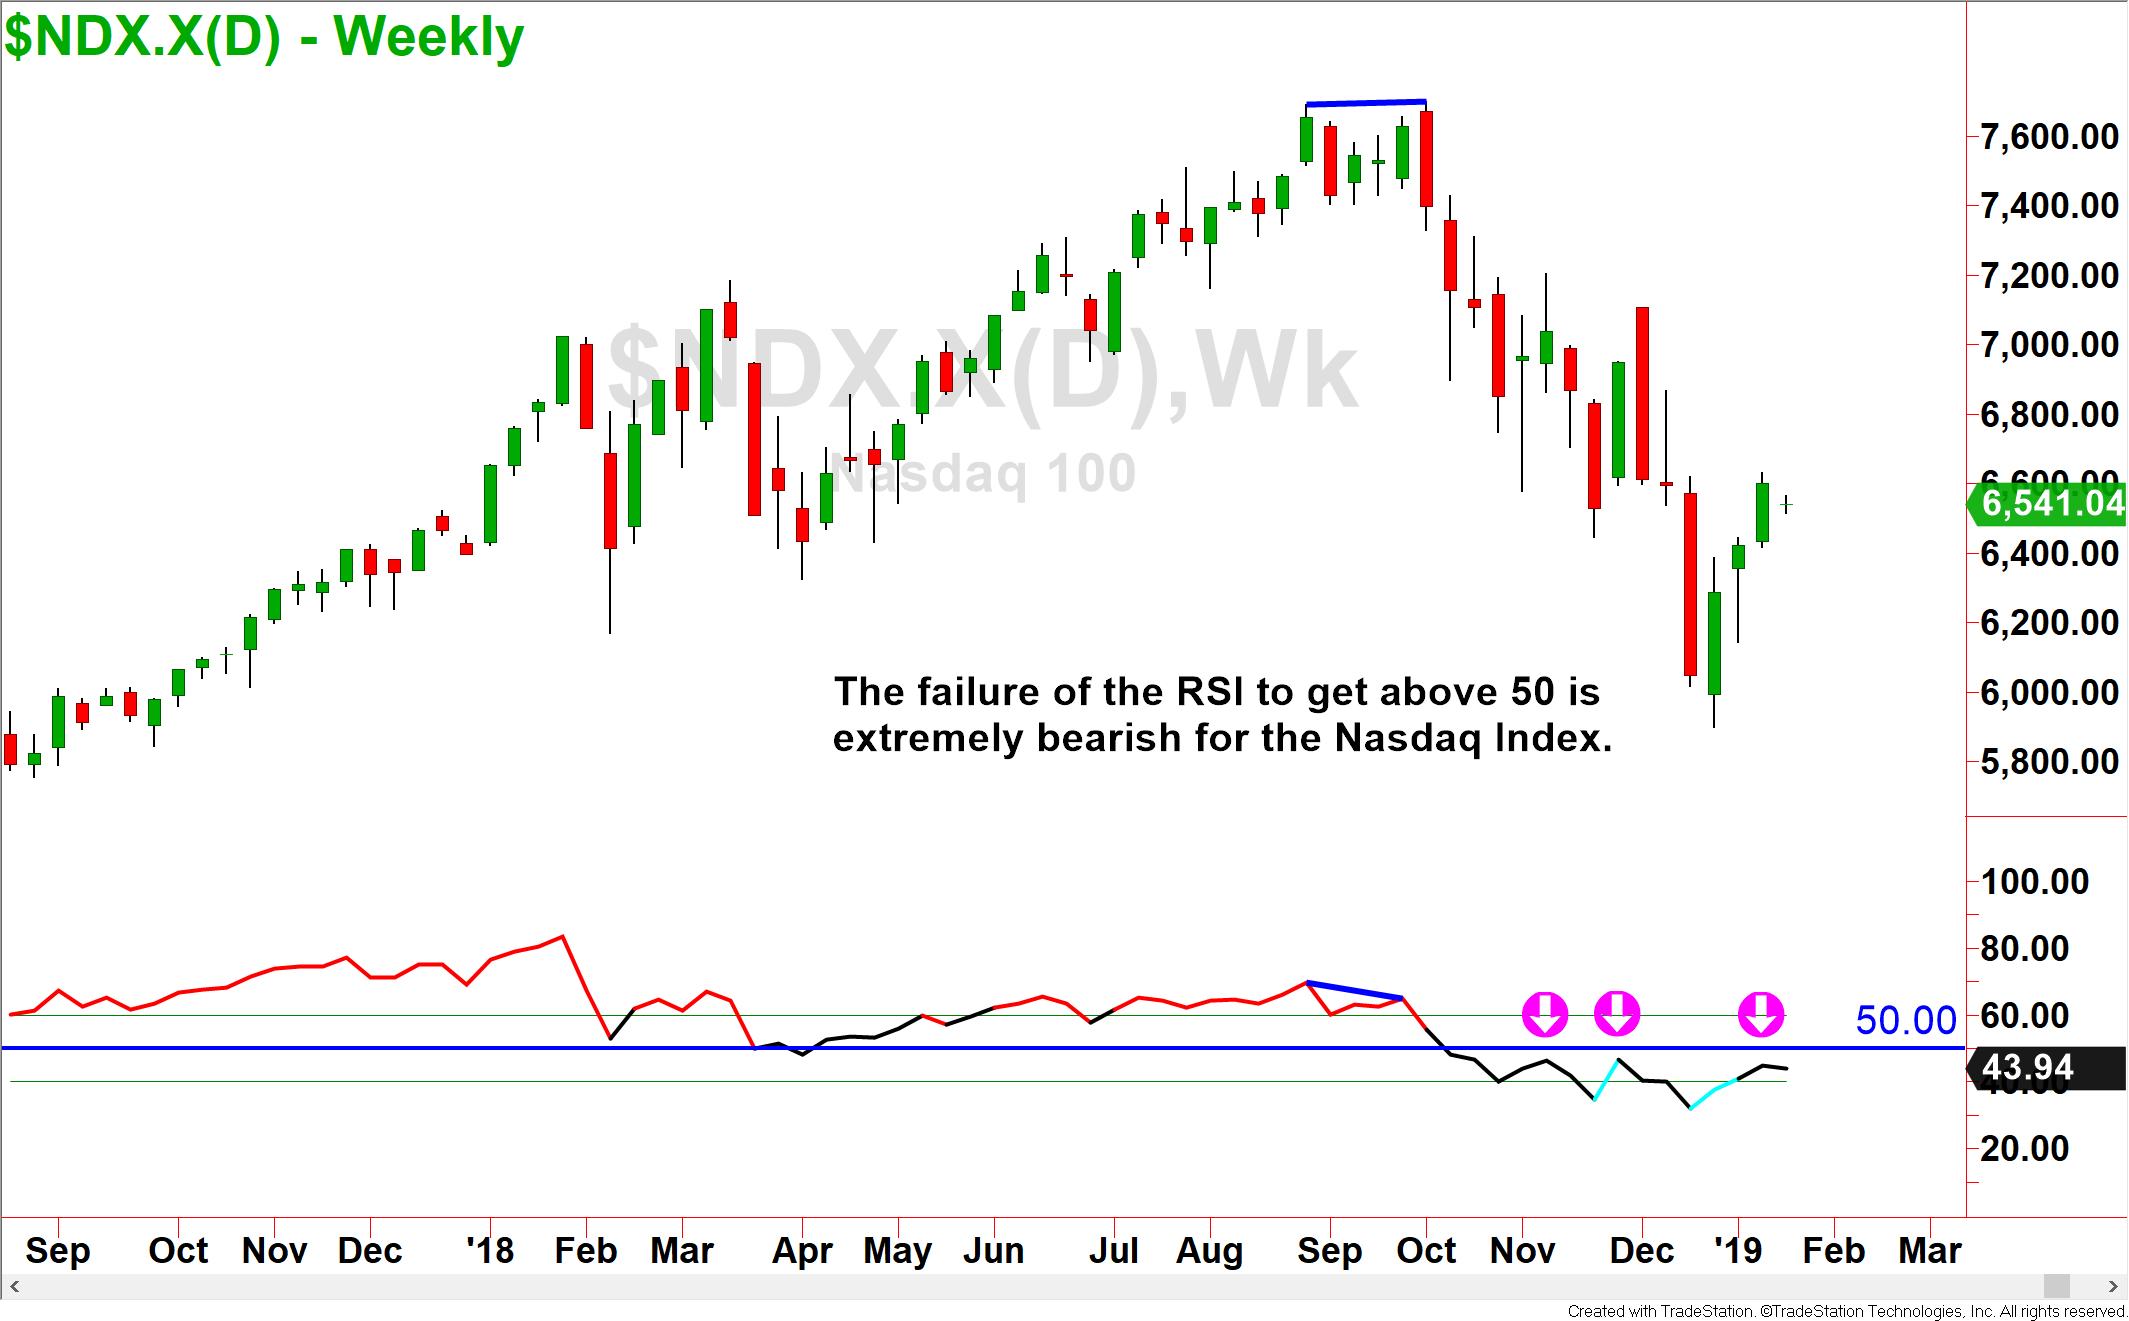
On the daily chart, the Nasdaq is primed to turn lower from the current supply zones it is trading in, too.
So where does this leave us? If you listen to most brokers and money managers, they will tell you to just hang in there and that your money will be fine. But was it fine in 2008 to watch your retirement accounts lose nearly 50% of their value and be forced to wait for five years for them to get back into positive territory?
The markets tell you where they are going. You need to listen and act. We only have so much time in our lives. When we suffer through bear markets due to inaction, it delays our ability to retire comfortably. Do not be a victim of bad financial advice, take charge of your own accounts and become an educated investor. There are excellent opportunities for you to grow your wealth even in bear markets. Do not sit by and waste your precious time. Learn how you can invest and trade the right way so that you can enjoy life on your terms!
Read the original article here - Dire Market Warnings
Neither Freedom Management Partners nor any of its personnel are registered broker-dealers or investment advisers. I will mention that I consider certain securities or positions to be good candidates for the types of strategies we are discussing or illustrating. Because I consider the securities or positions appropriate to the discussion or for illustration purposes does not mean that I am telling you to trade the strategies or securities. Keep in mind that we are not providing you with recommendations or personalized advice about your trading activities. The information we are providing is not tailored to any individual. Any mention of a particular security is not a recommendation to buy, sell, or hold that or any other security or a suggestion that it is suitable for any specific person. Keep in mind that all trading involves a risk of loss, and this will always be the situation, regardless of whether we are discussing strategies that are intended to limit risk. Also, Freedom Management Partners’ personnel are not subject to trading restrictions. I and others at Freedom Management Partners could have a position in a security or initiate a position in a security at any time.
Editors’ Picks

EUR/USD holds firm near 1.1850 amid USD weakness
EUR/USD remains strongly bid around 1.1850 in European trading on Monday. The USD/JPY slide-led broad US Dollar weakness helps the pair build on Friday's recovery ahead of the Eurozone Sentix Investor Confidence data for February.

GBP/USD holds medium-term bullish bias above 1.3600
The GBP/USD pair trades on a softer note around 1.3605 during the early European session on Monday. Growing expectation of the Bank of England’s interest-rate cut weighs on the Pound Sterling against the Greenback.

USD/JPY keeps the red below 157.00 on intervention risks
The Japanese Yen sticks to its modest intraday recovery gains against a broadly weaker US Dollar on the back of speculations that authorities will step in to stem weakness in the domestic currency. In fact, Japanese officials stepped up intervention warnings and confirmed close coordination with the US against disorderly FX moves. This, in turn, triggered an intraday USD/JPY turnaround from the 157.65 region, or a two-week top, touched in reaction to Prime Minister Sanae Takaichi's landslide win in Sunday's election.
Editors’ Picks
EUR/USD holds firm near 1.1850 amid USD weakness
EUR/USD remains strongly bid around 1.1850 in European trading on Monday. The USD/JPY slide-led broad US Dollar weakness helps the pair build on Friday's recovery ahead of the Eurozone Sentix Investor Confidence data for February.
USD/JPY keeps the red below 157.00 on intervention risks
The Japanese Yen sticks to its modest intraday recovery gains against a broadly weaker US Dollar on the back of speculations that authorities will step in to stem weakness in the domestic currency. In fact, Japanese officials stepped up intervention warnings and confirmed close coordination with the US against disorderly FX moves. This, in turn, triggered an intraday USD/JPY turnaround from the 157.65 region, or a two-week top, touched in reaction to Prime Minister Sanae Takaichi's landslide win in Sunday's election.

Gold remains supported by China's buying and USD weakness as traders eye US data
Gold struggles to capitalize on its intraday move up and remains below the $5,100 mark heading into the European session amid mixed cues. Data released over the weekend showed that the People's Bank of China extended its buying spree for a 15th month in January. Moreover, dovish US Fed expectations and concerns about the central bank's independence drag the US Dollar lower for the second straight day, providing an additional boost to the non-yielding yellow metal.

Cardano steadies as whale selling caps recovery
Cardano (ADA) steadies at $0.27 at the time of writing on Monday after slipping more than 5% in the previous week. On-chain data indicate a bearish trend, with certain whales offloading ADA. However, the technical outlook suggests bearish momentum is weakening, raising the possibility of a short-term relief rebound if buying interest picks up.

Japanese PM Takaichi nabs unprecedented victory – US data eyed this week
I do not think I would be exaggerating to say that Japanese Prime Minister Sanae Takaichi’s snap general election gamble paid off over the weekend – and then some. This secured the Liberal Democratic Party (LDP) an unprecedented mandate just three months into her tenure.
RECOMMENDED LESSONS
Making money in forex is easy if you know how the bankers trade!
I’m often mystified in my educational forex articles why so many traders struggle to make consistent money out of forex trading. The answer has more to do with what they don’t know than what they do know. After working in investment banks for 20 years many of which were as a Chief trader its second knowledge how to extract cash out of the market.
5 Forex News Events You Need To Know
In the fast moving world of currency markets where huge moves can seemingly come from nowhere, it is extremely important for new traders to learn about the various economic indicators and forex news events and releases that shape the markets. Indeed, quickly getting a handle on which data to look out for, what it means, and how to trade it can see new traders quickly become far more profitable and sets up the road to long term success.
Top 10 Chart Patterns Every Trader Should Know
Chart patterns are one of the most effective trading tools for a trader. They are pure price-action, and form on the basis of underlying buying and selling pressure. Chart patterns have a proven track-record, and traders use them to identify continuation or reversal signals, to open positions and identify price targets.
7 Ways to Avoid Forex Scams
The forex industry is recently seeing more and more scams. Here are 7 ways to avoid losing your money in such scams: Forex scams are becoming frequent. Michael Greenberg reports on luxurious expenses, including a submarine bought from the money taken from forex traders. Here’s another report of a forex fraud. So, how can we avoid falling in such forex scams?
What Are the 10 Fatal Mistakes Traders Make
Trading is exciting. Trading is hard. Trading is extremely hard. Some say that it takes more than 10,000 hours to master. Others believe that trading is the way to quick riches. They might be both wrong. What is important to know that no matter how experienced you are, mistakes will be part of the trading process.
The challenge: Timing the market and trader psychology
Successful trading often comes down to timing – entering and exiting trades at the right moments. Yet timing the market is notoriously difficult, largely because human psychology can derail even the best plans. Two powerful emotions in particular – fear and greed – tend to drive trading decisions off course.