How NOT to Lose 100% of Your Account

Have you ever had a trading strategy that just started losing? Maybe, you spent hours and hours coding, testing and watching the markets in a demo environment. Then, you finally turn your strategy live, and it just starts losing right out of the gate?
What do you do now?
Do you keep trading it? Do you stop?
Was there something wrong with your testing or programming?
I am not going to dig into this last question today, but I would like to address what you can and should do now.
What do you do when your trading strategy starts losing?
I may start to sound like a broken record but having a method for turning on and off a trading strategy is one of the most important aspects of trading. Knowing whether the drawdown is a normal part of your trading strategy, or if it is something different, is extremely important to protect your account from losing more than it needs to.
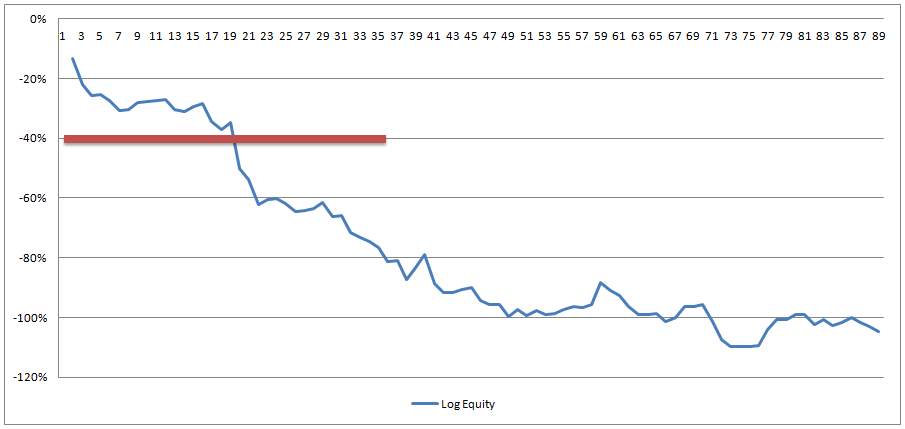
Here is an example of a strategy that started to fail right after being deployed (on a live money Forex account). As you can see, the account may have been levered up too much to have such a drop so quickly. There is no real excuse for losing 25% after three trades, is there?
So, when does the trader shut the strategy down?
Do you base that decision on the actual trading vs. the historical results? In this case, if the maximum drawdown was 40% historically, then you would stop trading as soon as the drawdown in the account is great than that, say 45%?
What if there was a really simple way to tell when to stop trading a strategy that doesn’t wait until you lose all that money?
Trading the equity curve is a great way to know when to turn on and off a trading strategy. The basics of equity curve trading are quite simple. When your current equity is above its moving average, you trade as you normally would. If it is below, you stop trading, trade in a demo account or trade the minimum trade size available.
In essence, you can use the moving average to determine whether or not to take the next trade, and you can also use it to determine whether to trade larger or smaller volumes.
Of course, equity curve trading requires that your trading history has some sort of pattern in it. Meaning, winning trades tend to follow winning trades and losing trades tend to follow losing trades.
Here is the same trader’s equity curve with 10 and 20 trade moving averages added.
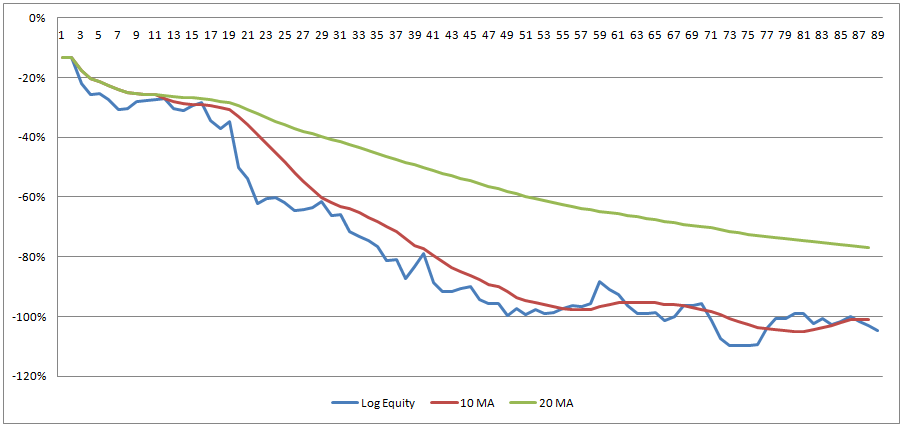
If you are familiar with trading with moving averages, you already have a good idea of when this trader should have turned off this strategy just by looking at this chart. This trader was instantly under both moving averages as soon as trading started in this account. That is a clear indication to stop trading.
Maybe, he should have switched back to trading this strategy in a demo account while under the moving average. If, in the future, the strategy begins performing again and the equity curve goes above its moving average, he can deploy to live trading again.
Two moving averages are shown above because you should be sure both “scenarios” are telling a similar story. These certainly are! They are shouting, “stop trading!”
If a small change to the moving average would affect the signal to turn on/off the trading strategy, then, you should not be very confident in using this method.
How about seeing the affect on actual profits and losses?
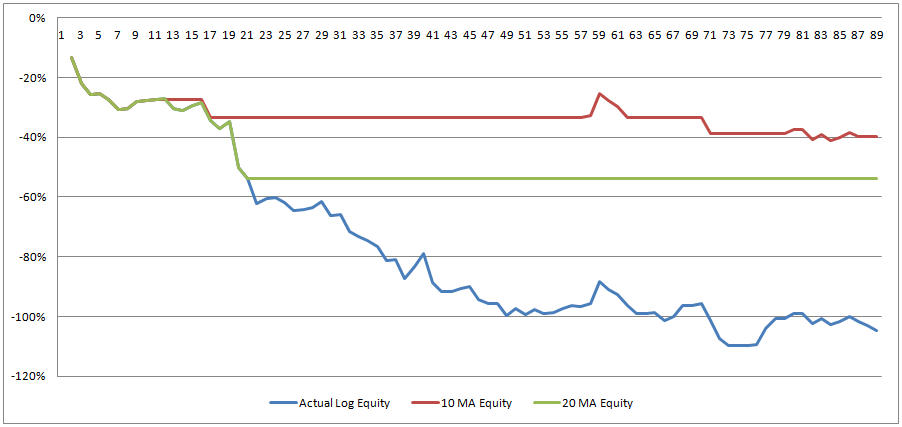
These are by no means pretty equity curves, BUT compared to the actual equity curve, they should be seen as nothing short of amazing!
Instead of losing 105% of the traders account (using the 10 MA equity curve trading strategy), this trader would have only lost 40% of his trading account. The 20 trade moving average version would have fared worse at a loss of 54%. Both are significantly better than the actual performance.
Most of the losses are due to including the performance for the trades before the moving average length. We don’t know the average of 10 trades until we have 10 trades so we trade until we have enough data.
You may be asking how a trader can lose more than 100% of his account. Does that even make sense? Well this trader lost most of his account and added more funds to keep trading. If he had used equity curve trading to manage his account, he would be in a much better position right now, don’t you think?
But what if you wanted something that works faster?
What if you don’t want to wait until you have traded 10, 20 or more trades to know if you should keep your, recently turned live, strategy active?
Well, you could start your moving average as soon as you start trading and not wait the full minimum number of trades. If you are just turning a strategy on live, it might be a good idea not to wait.
How does not waiting the full “warm up period” (10 or 20 trades) affect the performance?
Let’s find out.
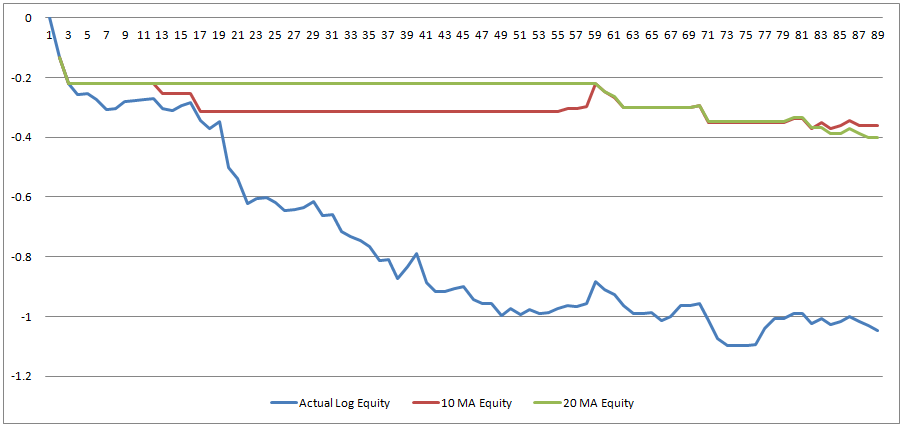
Of course, we had to wait two trades to get an average, and boy that did hurt. Those first two trades accounted for a loss of 22%. Overall, using this strategy allowed the trader to save a significant amount of his account, ending up with a loss of 36% (vs. the 105% loss of the actual trading). This is using the 10 length moving average method.
If this trader would have followed the 20 trade moving average, his strategy would have remained off longer initially but then lost a little more near the end. That would have lead to only a loss of 40% of his account vs. the full 105% loss.
As you can see, using equity curve trading along with your existing trading strategy, can be very useful for lowering drawdowns. It is also a great method for knowing when to turn on and off a trading strategy. Remember, this works best for trading strategies where wins and losses tend to run in streaks historically.
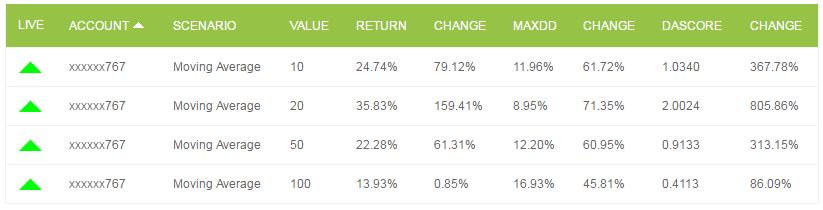
Daticks trading dashboard offers an easy way to see when each of the scenarios (moving averages in the example) are above their respective threshold. A green up arrow shows that your current equity is above each of the available moving averages.

Author

Steven Nauta, MBA
Daticks
Steve Nauta began his career in the trading industry working on the trading desk at a global foreign currency brokerage.


