For a successful trading and portfolio management, there are three steps we must follow:
- The first is about ability.The ability to be obtained the optimal size of investment and trading positions
- The second is about value. The kind of strategies that need to follow according to the long- and short-term valuation.
- the third is about skills.Skills to create the tools for both to calculate the optimal size as well as to implement the appropriate strategies that need to be followed.
Searching for the optimal size of an investment and trading position is a constant challenge for investors and traders. Finding the optimal size is an essential step for the successful portfolio and trading management, whether it concerns multi-million-dollar investment on assets or short-term trading on them. However, the calculation of optimal size, although necessary, is not well studied, especially by short-term traders.
Traders, as well as investors, usually decide the size of exposure in an investing or trading position based on their forecasts of expected returns. The stronger their expectations for a financial asset, i.e. a commodity, a currency pair, a stock, etc., the higher the exposure to that financial asset and the greater the trade in it.
That sounds fair, but in the long run, it is about a misleading perception, for two main reasons:
1. In the real world, forecasts regarding the expected return on a financial asset are rarely accurately confirmed. This means that investors and traders when they calculate the size of a position based on expected returns, most probably will either get an over-exposed or an under-exposed investment or trading position.
2. As the size of an investment and trading position is based on positive expected returns, two critical questions remain unanswered: What happens if expected returns turn negative and what should be the maximum tolerance if negative returns occur.
To tackle the above issues, we need to calculate the size of an investment or trading position with a different approach. The approach is concentrated on just two critical points which are:
to set the percentage of potential losses for each investment or trading position concerning the total amount of initial capital to be invested or traded, and,
to define for each financial asset to be invested or to be traded, the price loss level, i.e. the maximum limit of price movement that may be contrary to the expectations of investors or traders.
In more detail, the steps we need to follow to develop the methodology for calculating the optimal size of an investment or trading position are the following:
Step No1
- Calculate the loss of money as the percentage of the maximum potential loss that an individual investment or trading position can cause relative to the total wealth invested or traded.
It is strongly recommended that for any position invested or traded, no loss greater than 0.5% to 2% of total initial investment or trading capital will be caused. This means that if, for example, the total initial capital for trading or invested positions is $100,000, then for each position of a financial asset that may results contrary returns, that is, loss of money, these losses cannot exceed $500 to $2,000 relative to the total initial capital, as according to the calculations, each position of a financial asset should not exceed 0.5% to 2% of total invested or trading capital.
See the relative calculations:
$100,000*0.5%=$500 money loss per position]
and
[$100,000*2%=$2,000 money loss per position].
Step No2
- Determine the maximum price drop threshold for a financial asset, i.e. stock, bond, commodity, etc. As this level indicates the stop loss order if the level breaks, the investment or trading position of that financial asset will cease to exist.
For example:
Suppose that the price of a financial asset i.e. a stock XYZ listed in the New York Stock Exchange is $30. Suppose then that it is determined that the price drop limit for this stock is $2.6. Therefore, if there is a decline in its price below $ 27.4 ($30-$2.6=$27.4), the stop-loss order is triggered thus the investment or trading position of that financial asset will cease to exist.
Step No3
By combining the first and the second steps, we can calculate in a straightforward way the optimum size of an investment position.
The calculation is based on simplicity and logic.
By dividing,
- for a financial asset, the amount of maximum potential loss to the total initial capital invested or trading, with
- the amount of stop loss of this financial asset,
we find the optimal position size for this financial asset.
The above mathematical fraction gives the optimal investment or trading position because it can cause limited losses of 0.5% to 2% of total invested or trading capital, while the potential profits can be unlimited.
Thus, by knowing just three numbers which are:
- the percentage of maximum potential loss for each investment or trading position relative to the total amount to be invested or traded, which is defined for example 0.5%
- the total amount to be invested or traded, where for the above example is $100,000
- the maximum price drop limit for a financial asset, that from the above example is $2.6 for the Stock XYZ
we can then calculate the optimum size for this investment or trading position,as follows:
Optimum Size (for Investment or Trading Position)=
TOTAL AMOUNT OF CAPITAL TO BE INVESTED OR TRADED [$100,000]*MAXIMUM POTENTIAL LOSS FOR AN INVESTMENT OR TRADING POSITION [0.5%]/
(MAXIMUM PRICE DROP LIMIT FOR A FINANCIAL ASSET [$2.6]
= ($100,000 * 0.5%) / $2.6 = 192 Shares
By holding 192 XYZ shares, in the above example, it is guaranteed that as the stop-loss order is set at $27.4, the potential loss for this investment or trading position cannot exceed $500 money losses while profits have no limits.
Τhe amount of capital we need for this investment or trading position is calculated as follows:
Capital for Investment or Trading Position =
= Number of Shares * Price of the Share= 192 * $30 = $5,760
To calculate the capital used as a percentage of total capital to be invested or traded we divide the capital for investment or trading position which is in the example $5,769 with the total amount of capital to be invested or traded which is $100,000.
($5,760/100,000) *100 =5,76%
For an investment or trading position, as strongly recommended above, the maximum potential loss in terms of total capital to be invested or traded could range from 0.5% to 2%. Therefore, in different scenarios, we will have the results presented in the table below:
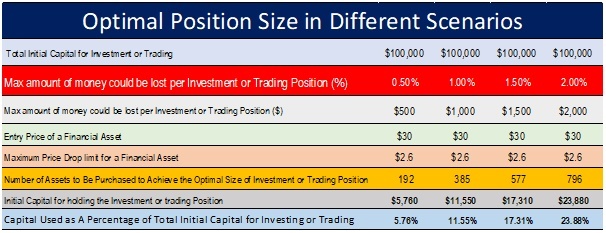
The advantage of this methodology is that the optimal size of investment or trading position changes, only when changing the maximum potential loss concerning the total capital to be invested or traded, while the potential money loss on an investment or trading position cannot exceed 2% of the total invested or traded capital.
One disadvantage of this methodology, however, is that an investment or trading position may require a large proportion of the capital to be invested or traded, as in the example above. When the maximum potential loss is 2%, the capital required as a percentage of total capital to be invested or treated, reaches to 23.9%.
To overcome this disadvantage, we can use derivatives markets as the CFD market.
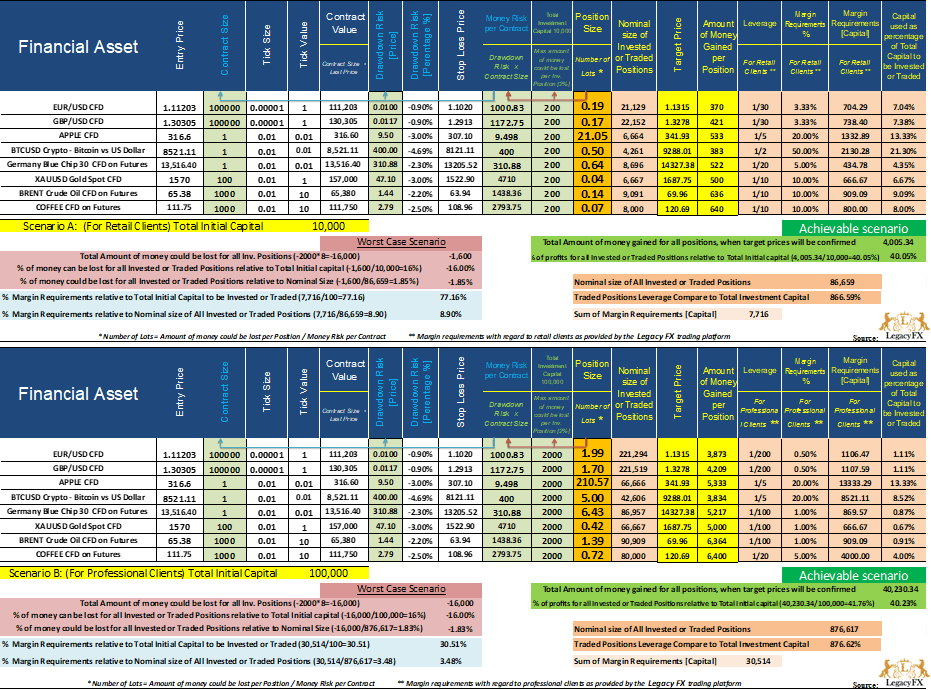
Thus, in the following examples presented in the tables below, we can see in two scenarios, a portfolio of multiple invested or traded positions consisting of eight different financial products where the respective CFDs have different contract sizes and leverage characteristics.
- (Scenario A) The total capital invested is 10,000, where leverage refers to retail clients.
- (Scenario B) The total capital invested is 100,000, where leverage refers to professional clients.
The critical advantages of the methodology that is introduced are the following:
- For all the positions invested or traded in the example above, in the worst-case scenario, where stop-loss orders are activated for all eight invested or traded positions in the examples, the percentage of money that may be lost cannot exceed 16% of total initial capital (excluding commissions).
[2% potential loss for each position in a financial asset * 8 positions = 16%].
Therefore, the percentage of total money losses,in the worst-case scenario, is limited to a relatively small amount [-16%].
- The nominal size of all invested or traded positions due to the leverage provided by CFDs is much higher than the initial capital. As shown in our example, for retail clients, the nominal size compared to the initial capital of 10,000 reaches the level of 86,659 which means that it is 866.59% higher than the initial capital. For professional clients, the nominal size of all invested or traded positions, compared to the initial equity of 100,000, goes to the level of 876,617 which means that it is higher by 876.62% than the initial equity.
- Notice the remarkable fact that, while the nominal size of the investment or trading position, due to the leverage provided by the CFDs, is high relative to the initial capital, the potential losses are still limited to -1,600 in the first scenario and -16,000 in the second scenario. In fact, relative to the nominal position,the limited losses as a proportion of the nominal size of all invested or traded positions are even lower. Thus, in our examples, the maximum potential money losses for all positions in percentage, relative to the nominal size of the investment or trading position is only 1.85% in the first scenario and 1.83% in the second scenario.
- As the CFD market requires only a marginal capital, the sum of the margin requirements of the invested or traded position is in our example for the retail client 7,716 while, for the professional clients is 30,514. Therefore, concerning total initial capital, the percentage of margin requirements is 77.16% for the retail clients and 30.51% for the professional clients, while concerning the nominal size of all invested or traded positions, the percentages of margin requirements in the examples are only 8.9% for the retail clients and 3.48% in the professional clients.
- The model sets limits relative to negative price movement, also, sets limits to maximum loss up to 2% for each investment or trading position relative to the total amount to be invested or traded. On the other hand, it does not set limits on the positive movement of prices, therefore, potential earnings per position may be significant when the target prices for the financial assets invested or traded are reached.In our example, the total amount of money that could be earned as a profit for all positions when the targetprices will be confirmed is 4,005.34 for the retail clients, representing rate of return 40.05% compared to the initial capital and 40,230.34 for the professional clients, representing rate of return 40.23%, also, compare to the initial capital.
In the following weeks will be discussed how, by following simple and effective strategies for investments and trading, target prices can be achieved, as well as, will be discussed the ways of how profitable positions are protected.
CFDs are complex instruments and come with a high risk of losing money rapidly due to leverage. You should consider whether you understand how CFDs work and whether you can afford to take the high risk of losing your money. The Article/Information available on this website is for informational purposes only, you should not construe any such information or other material as investment advice or any other research recommendation. Nothing contained on this Article/ Information in this website constitutes a solicitation, recommendation, endorsement, or offer by LegacyFX and A.N. ALLNEW INVESTMENTS LIMITED in Cyprus or any affiliate Company, XE PRIME VENTURES LTD in Cayman Islands, AN All New Investments BY LLC in Belarus and AN All New Investments (VA) Ltd in Vanuatu to buy or sell any securities or other financial instruments in this or in in any other jurisdiction in which such solicitation or offer would be unlawful under the securities laws of such jurisdiction. LegacyFX and A.N. ALLNEW INVESTMENTS LIMITED in Cyprus or any affiliate Company, XE PRIME VENTURES LTD in Cayman Islands, AN All New Investments BY LLC in Belarus and AN All New Investments (VA) Ltd in Vanuatu are not liable for any possible claim for damages arising from any decision you make based on information or other Content made available to you through the website, but investors themselves assume the sole responsibility of evaluating the merits and risks associated with the use of any information or other Article/ Information on the website before making any decisions based on such information or other Article.
Editors’ Picks
EUR/USD edges lower toward 1.0700 post-US PCE

EUR/USD stays under modest bearish pressure but manages to hold above 1.0700 in the American session on Friday. The US Dollar (USD) gathers strength against its rivals after the stronger-than-forecast PCE inflation data, not allowing the pair to gain traction.
GBP/USD retreats to 1.2500 on renewed USD strength

GBP/USD lost its traction and turned negative on the day near 1.2500. Following the stronger-than-expected PCE inflation readings from the US, the USD stays resilient and makes it difficult for the pair to gather recovery momentum.
Japanese Yen trades just shy of 157.00 versus the USD

The Japanese Yen weakens across the board after BoJ announced its policy decision. A shortlived spike in the Yen may be testament to an attempt by the Japanese authorities to intervene. US PCE Price Index shows higher-than-expected inflation but does little to impact USD/JPY which almost touches 157.00.
Editors’ Picks
EUR/USD edges lower toward 1.0700 post-US PCE
EUR/USD stays under modest bearish pressure but manages to hold above 1.0700 in the American session on Friday. The US Dollar (USD) gathers strength against its rivals after the stronger-than-forecast PCE inflation data, not allowing the pair to gain traction.
GBP/USD retreats to 1.2500 on renewed USD strength
GBP/USD lost its traction and turned negative on the day near 1.2500. Following the stronger-than-expected PCE inflation readings from the US, the USD stays resilient and makes it difficult for the pair to gather recovery momentum.
Gold struggles to hold above $2,350 following US inflation

Gold turned south and declined toward $2,340, erasing a large portion of its daily gains, as the USD benefited from PCE inflation data. The benchmark 10-year US yield, however, stays in negative territory and helps XAU/USD limit its losses.
Bitcoin Weekly Forecast: BTC’s next breakout could propel it to $80,000 Premium

Bitcoin’s recent price consolidation could be nearing its end as technical indicators and on-chain metrics suggest a potential upward breakout. However, this move would not be straightforward and could punish impatient investors.
Week ahead – Hawkish risk as Fed and NFP on tap, Eurozone data eyed too

Fed meets on Wednesday as US inflation stays elevated. Will Friday’s jobs report bring relief or more angst for the markets? Eurozone flash GDP and CPI numbers in focus for the Euro.
RECOMMENDED LESSONS
Making money in forex is easy if you know how the bankers trade!
Discover how to make money in forex is easy if you know how the bankers trade!
5 Forex News Events You Need To Know
In the fast moving world of currency markets, it is extremely important for new traders to know the list of important forex news...
Top 10 Chart Patterns Every Trader Should Know
Chart patterns are one of the most effective trading tools for a trader. They are pure price-action, and form on the basis of underlying buying and...
7 Ways to Avoid Forex Scams
The forex industry is recently seeing more and more scams. Here are 7 ways to avoid losing your money in such scams: Forex scams are becoming frequent. Michael Greenberg reports on luxurious expenses, including a submarine bought from the money taken from forex traders. Here’s another report of a forex fraud. So, how can we avoid falling in such forex scams?
What Are the 10 Fatal Mistakes Traders Make
Trading is exciting. Trading is hard. Trading is extremely hard. Some say that it takes more than 10,000 hours to master. Others believe that trading is the way to quick riches. They might be both wrong. What is important to know that no matter how experienced you are, mistakes will be part of the trading process.