![]() Brandon Wendell, CMT
Brandon Wendell, CMT
Brandon Wendell
As traders, we all want to find the highest probable turning points in the markets. At Online Trading Academy, our students learn how to find them through the discovery of high quality supply and demand zones. In addition to the zones, there are several Odds Enhancers that we teach that traders can use to increase their probability of success in the markets.
One odds enhancer is similar to a fuel gauge, the Average True Range (ATR). A fuel gauge in a car tells you how much gas you still have left. If you know your average miles per gallon for the car, you can figure out how far you can still travel without running out of gas. The ATR can tell you how much price movement you may experience before you run out of momentum.
The range of a stock’s price is the difference between the high price and the low price during a period of time. The true range is a little different in that it also includes any gapping that may have occurred from the prior period. So, the Average True Range measures the stock’s price vibration, (average movement between high and low) over a period of time. The default is usually 14 periods.
The ATR of a stock will differ based on the period you have your chart set for. If you are viewing a daily chart, the ATR will refer to the average movement that stock will make between the high and the low for the day. If you have your charts set for 15 minutes, then you will see the average movement for every 15-minute period. When viewing the ATR on a five-minute chart, you are seeing the average price movement for every five-minute candle.
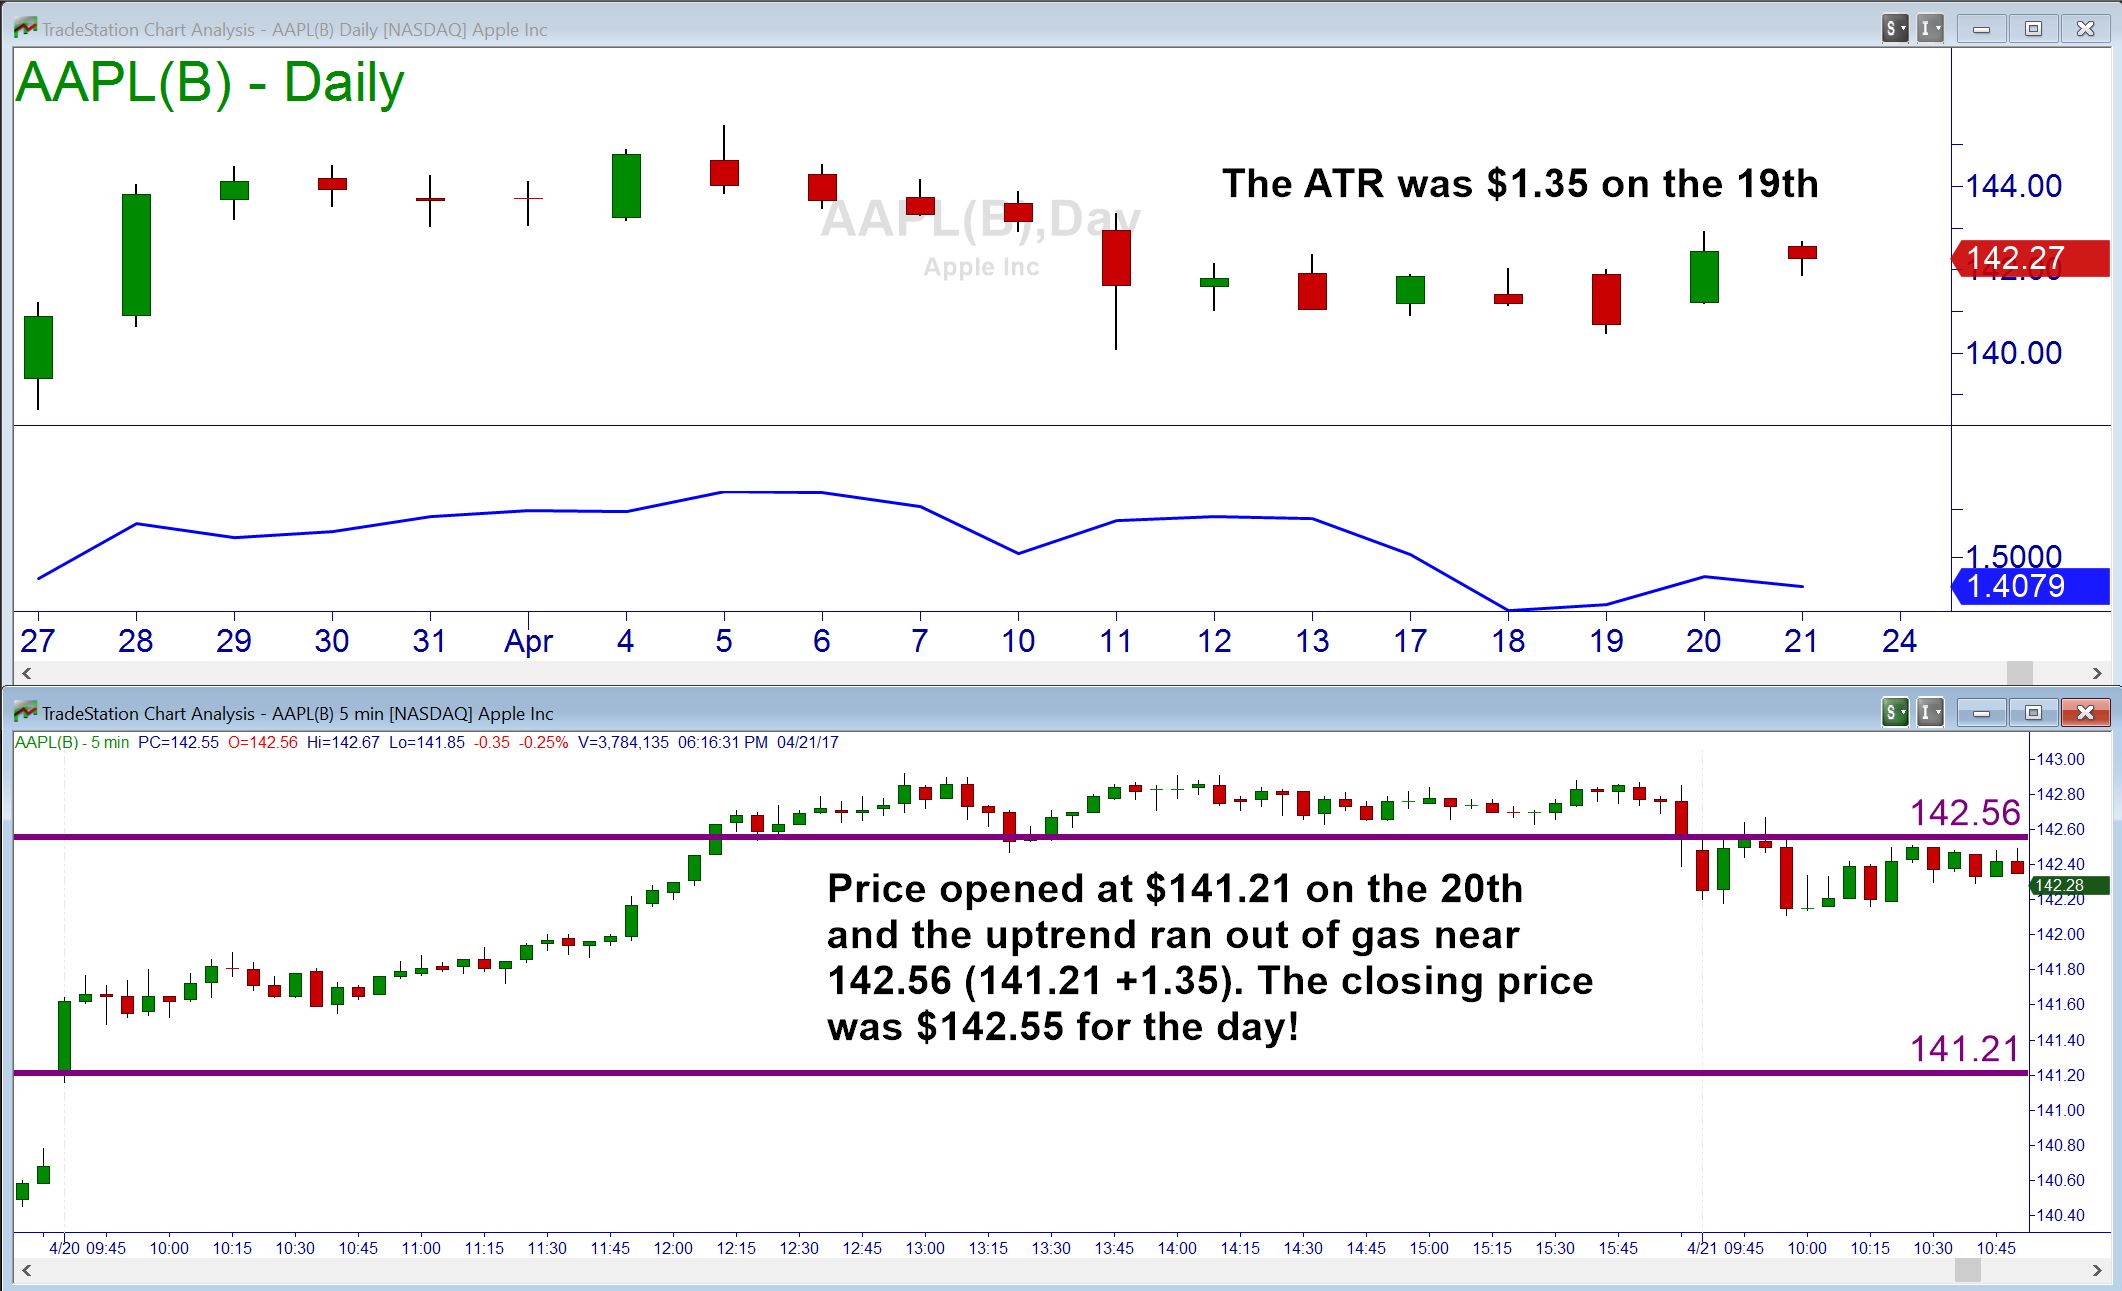
When price is trending strongly in a particular direction, knowing the ATR for that timeframe can offer you a clue as to when price may pause or reverse. For instance, in the following chart, Apple had a daily ATR of $1.35. On April 20th, price opened at $141.21 and ran upward. Once price reached the ATR it stalled and drifted sideways. Eventually, the stock closed one penny off of the projected ATR.
Additionally, when price reaches a supply or demand zone beyond the ATR, it is more likely to reverse. Though price may still have plenty of momentum when it reaches a supply or demand within the ATR.
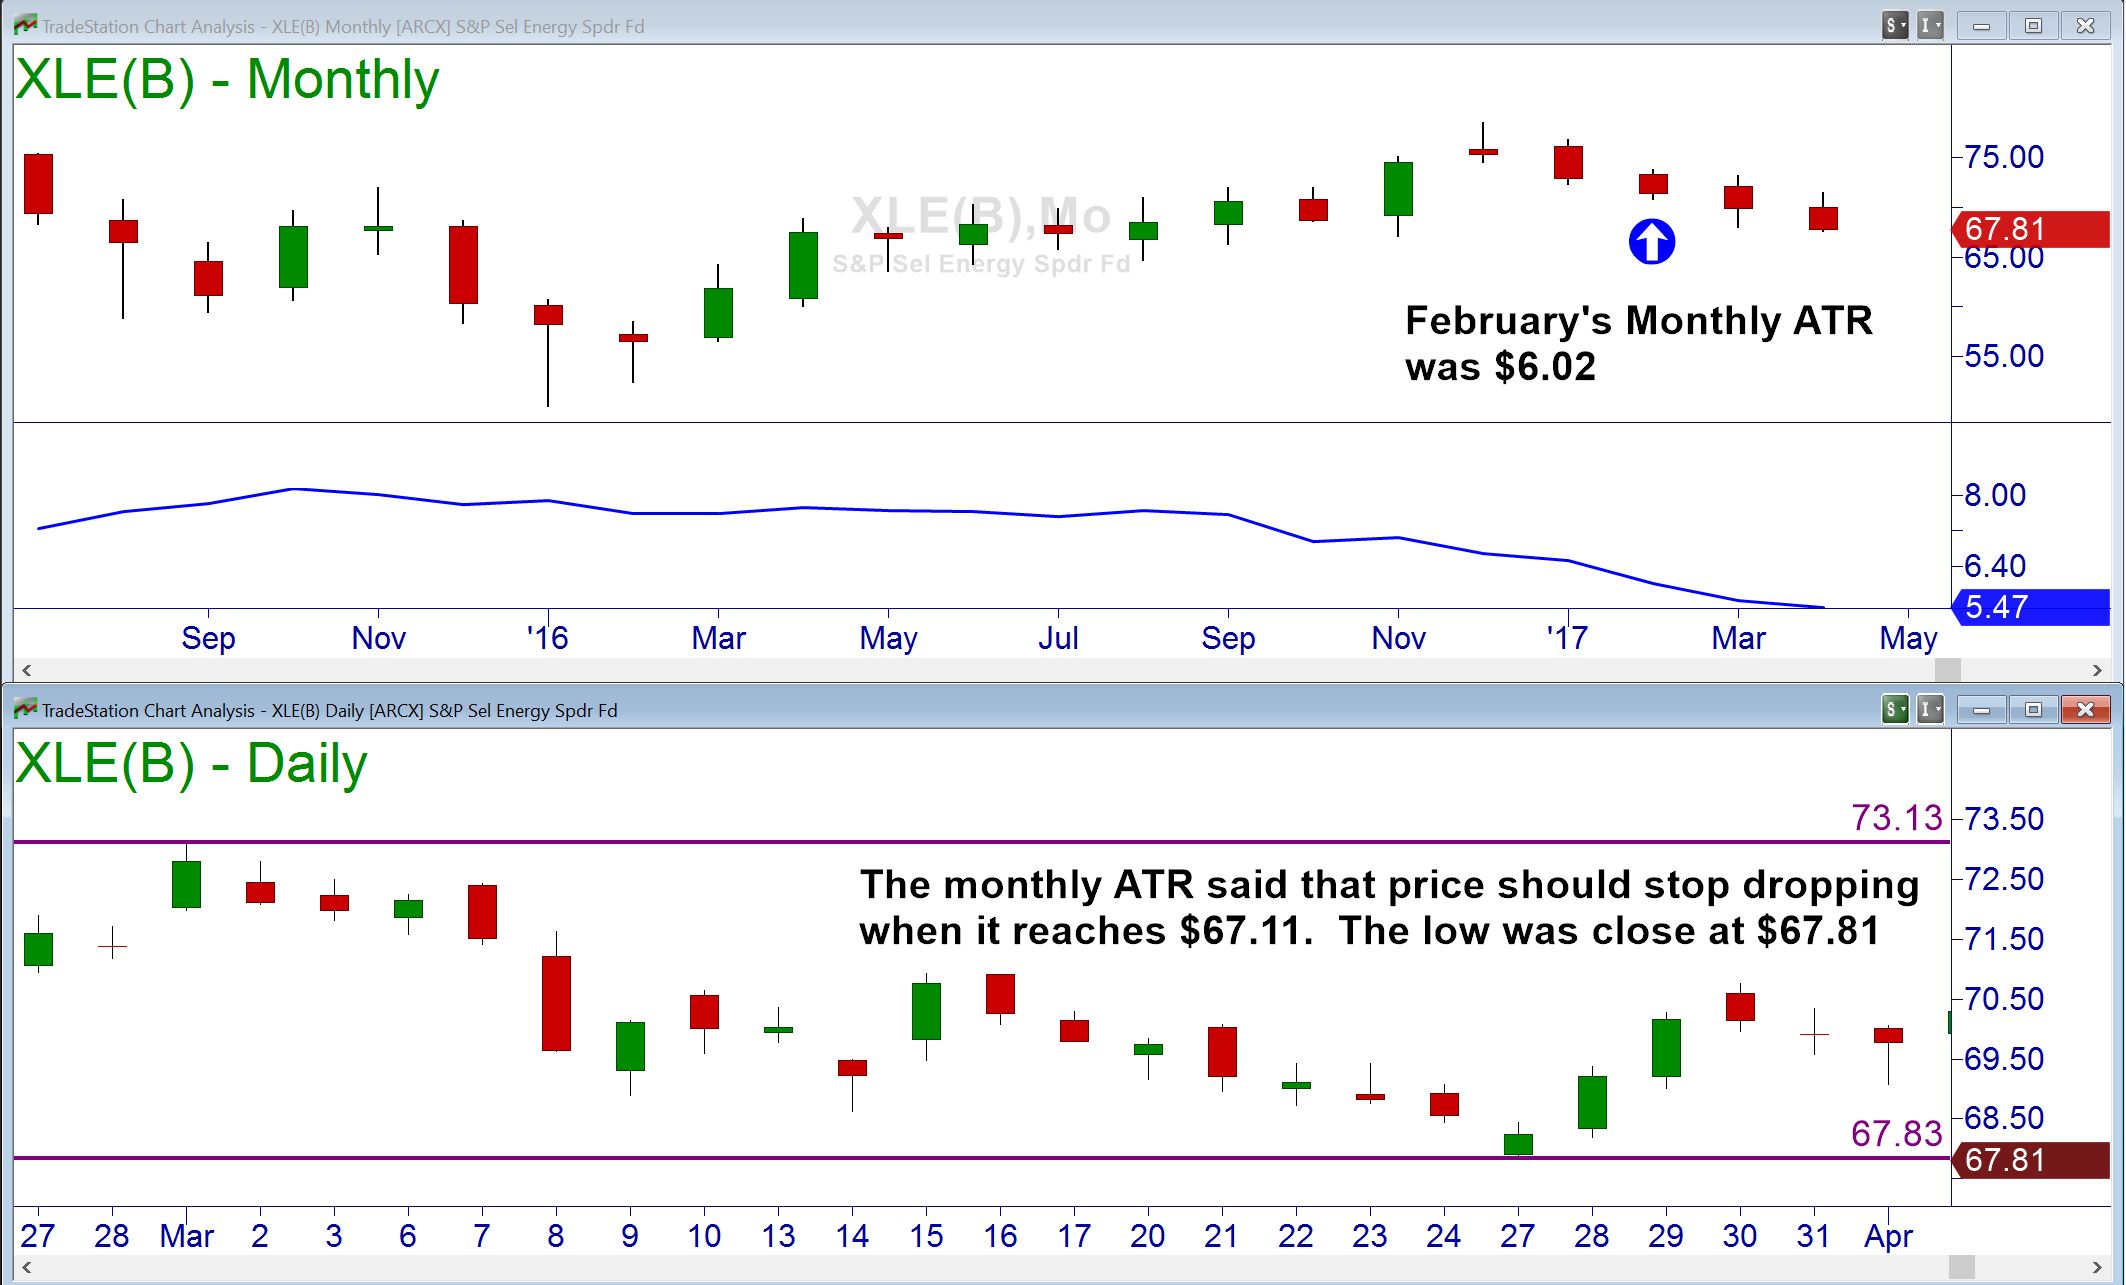
We can even use this ATR on a larger timeframe. For example, look at February’s ATR on XLE of $6.02. At the beginning of March, XLE opened and moved upwards before dropping most of the month. Subtracting the ATR from the high price of the month, we arrived at a target of $67.11 for the monthly trend. Just before “running out of gas,” prices reversed.
Neither Freedom Management Partners nor any of its personnel are registered broker-dealers or investment advisers. I will mention that I consider certain securities or positions to be good candidates for the types of strategies we are discussing or illustrating. Because I consider the securities or positions appropriate to the discussion or for illustration purposes does not mean that I am telling you to trade the strategies or securities. Keep in mind that we are not providing you with recommendations or personalized advice about your trading activities. The information we are providing is not tailored to any individual. Any mention of a particular security is not a recommendation to buy, sell, or hold that or any other security or a suggestion that it is suitable for any specific person. Keep in mind that all trading involves a risk of loss, and this will always be the situation, regardless of whether we are discussing strategies that are intended to limit risk. Also, Freedom Management Partners’ personnel are not subject to trading restrictions. I and others at Freedom Management Partners could have a position in a security or initiate a position in a security at any time.
Editors’ Picks

EUR/USD hovers around nine-day EMA above 1.1800
EUR/USD remains in the positive territory after registering modest gains in the previous session, trading around 1.1820 during the Asian hours on Monday. The 14-day Relative Strength Index momentum indicator at 54 is edging higher, signaling improving momentum. RSI near mid-50s keeps momentum balanced. A sustained push above 60 would firm bullish control.

GBP/USD holds medium-term bullish bias above 1.3600
The GBP/USD pair trades on a softer note around 1.3605 during the early European session on Monday. Growing expectation of the Bank of England’s interest-rate cut weighs on the Pound Sterling against the Greenback.

USD/JPY drops back below 157.00 on Japan's verbal intervention
USD/JPY has come under moderate selling pressure below 157.00 in the Asian session on Monday. The Japanese Yen lost ground to near 157.70 following Japan’s ruling Liberal Democratic Party's outright majority win in Sunday’s lower house election, opening the door to more fiscal stimulus by Prime Minister Sanae Takaichi. However, JPY buyers jumped back and dragged the pair southward on FX verbal intervention by Japan’s Finance Minister Katayama.
Editors’ Picks
EUR/USD hovers around nine-day EMA above 1.1800
EUR/USD remains in the positive territory after registering modest gains in the previous session, trading around 1.1820 during the Asian hours on Monday. The 14-day Relative Strength Index momentum indicator at 54 is edging higher, signaling improving momentum. RSI near mid-50s keeps momentum balanced. A sustained push above 60 would firm bullish control.

Gold sticks to gains above $5,000 as China's buying and Fed rate-cut bets drive demand
Gold surges past the $5,000 psychological mark during the Asian session on Monday in reaction to the weekend data, showing that the People's Bank of China extended its buying spree for a 15th month in January. Moreover, dovish US Federal Reserve expectations and concerns about the central bank's independence drag the US Dollar lower for the second straight day, providing an additional boost to the non-yielding yellow metal.
GBP/USD holds medium-term bullish bias above 1.3600
The GBP/USD pair trades on a softer note around 1.3605 during the early European session on Monday. Growing expectation of the Bank of England’s interest-rate cut weighs on the Pound Sterling against the Greenback.

Bitcoin, Ethereum and Ripple consolidate after massive sell-off
Bitcoin, Ethereum, and Ripple prices consolidated on Monday after correcting by nearly 9%, 8%, and 10% in the previous week, respectively. BTC is hovering around $70,000, while ETH and XRP are facing rejection at key levels.

Weekly column: Saturn-Neptune and the end of the Dollar’s 15-year bull cycle
Tariffs are not only inflationary for a nation but also risk undermining the trust and credibility that go hand in hand with the responsibility of being the leading nation in the free world and controlling the world’s reserve currency.
RECOMMENDED LESSONS
Making money in forex is easy if you know how the bankers trade!
I’m often mystified in my educational forex articles why so many traders struggle to make consistent money out of forex trading. The answer has more to do with what they don’t know than what they do know. After working in investment banks for 20 years many of which were as a Chief trader its second knowledge how to extract cash out of the market.
5 Forex News Events You Need To Know
In the fast moving world of currency markets where huge moves can seemingly come from nowhere, it is extremely important for new traders to learn about the various economic indicators and forex news events and releases that shape the markets. Indeed, quickly getting a handle on which data to look out for, what it means, and how to trade it can see new traders quickly become far more profitable and sets up the road to long term success.
Top 10 Chart Patterns Every Trader Should Know
Chart patterns are one of the most effective trading tools for a trader. They are pure price-action, and form on the basis of underlying buying and selling pressure. Chart patterns have a proven track-record, and traders use them to identify continuation or reversal signals, to open positions and identify price targets.
7 Ways to Avoid Forex Scams
The forex industry is recently seeing more and more scams. Here are 7 ways to avoid losing your money in such scams: Forex scams are becoming frequent. Michael Greenberg reports on luxurious expenses, including a submarine bought from the money taken from forex traders. Here’s another report of a forex fraud. So, how can we avoid falling in such forex scams?
What Are the 10 Fatal Mistakes Traders Make
Trading is exciting. Trading is hard. Trading is extremely hard. Some say that it takes more than 10,000 hours to master. Others believe that trading is the way to quick riches. They might be both wrong. What is important to know that no matter how experienced you are, mistakes will be part of the trading process.
The challenge: Timing the market and trader psychology
Successful trading often comes down to timing – entering and exiting trades at the right moments. Yet timing the market is notoriously difficult, largely because human psychology can derail even the best plans. Two powerful emotions in particular – fear and greed – tend to drive trading decisions off course.