ATR Indicator Explained

After reading this article on the ATR indicator, a trader will find out that:
- Originally developed by J. Welles Wilder, American mechanical engineer, in his book „New Concepts in Technical Trading Systems“
- Potential of confirming reversals
- Calculation of ATR Indicator
- Using for risk calcuation and position sizing
The Average True Range (ATR) is a simple yet very effective technical indicator, developed by the American mechanical engineer J.Welles Wilder. In his 1974 book „New Concepts in Technical Trading Systems“, Wilder featured the Average True Range indicator. He also developled other extremely popular technical indicators, like the RSI, Parabolic SAR and the ADX (Directional Movement Concept).
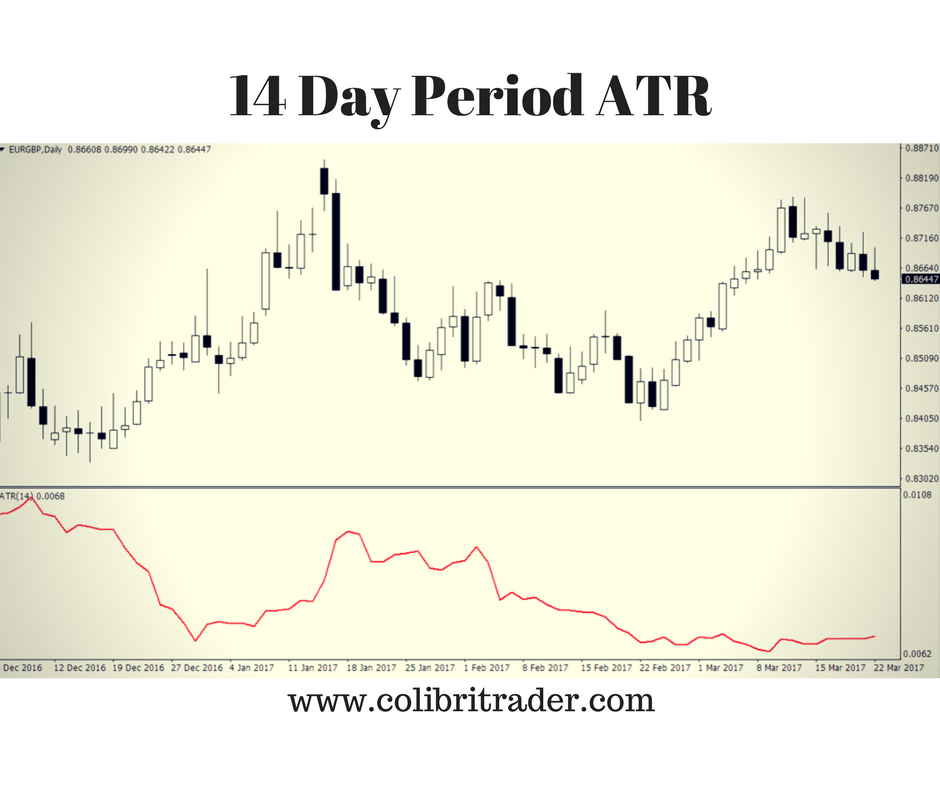
Originally developed for stocks and commodities, this indicator can also easily be adapted to Forex. The ATR indicator provides an indication of price volatility in absolute terms, as Wilders was not interested in price direction for this indicator. Wilders recommends using a 14-period ATR on a daily time-frame. Simply put, a currency pair which has larger movements and higher volatility, will also have a higher value for its ATR reading. On the other hand, a currency pair which is trading sideways will have a lower ATR reading. These values are of big interest to traders, as they can easily gauge the price volatility and make better decisions about position sizing, and the size of stop loss and limit orders. In some cases, the ATR can be used as a confirmation for bullish or bearish reversals. A growing ATR value in the beginning of a possible reversal might be used as a confirmation signal, as it shows rising momentum of long or short positions.
The Average True Range calculation is based on the N-day moving average of the true range values for a given currency pair (or other financial instrument).
The True Range is a concept Wilders described as the highest value of the following:
The current High minus the current Low
The absolute value of the current High minus the previous Close
The absoulute value of the current Low minus the previous Close
This concept is introduced because Wilders was interested in the price volatility of commodities during the development of the ATR indicator. As the trading volume on commodities is usually very low and thus price gaps often occur, simple volatility calculations based on the current Highs and Lows did not give adequate results. Instead, using True Ranges for volatility calculations, which take into account gaps from previous sessions, give much better results.
For example, if the current High is above the previous Close, and the current Low is equal or below the previous Close, then the current High minus Low will be used as the True Range value, that is method (a). On the other hand, if the current session opened with a gap or the current session is an inside bar, then methods (b) or (c) will be used, whichever is larger.
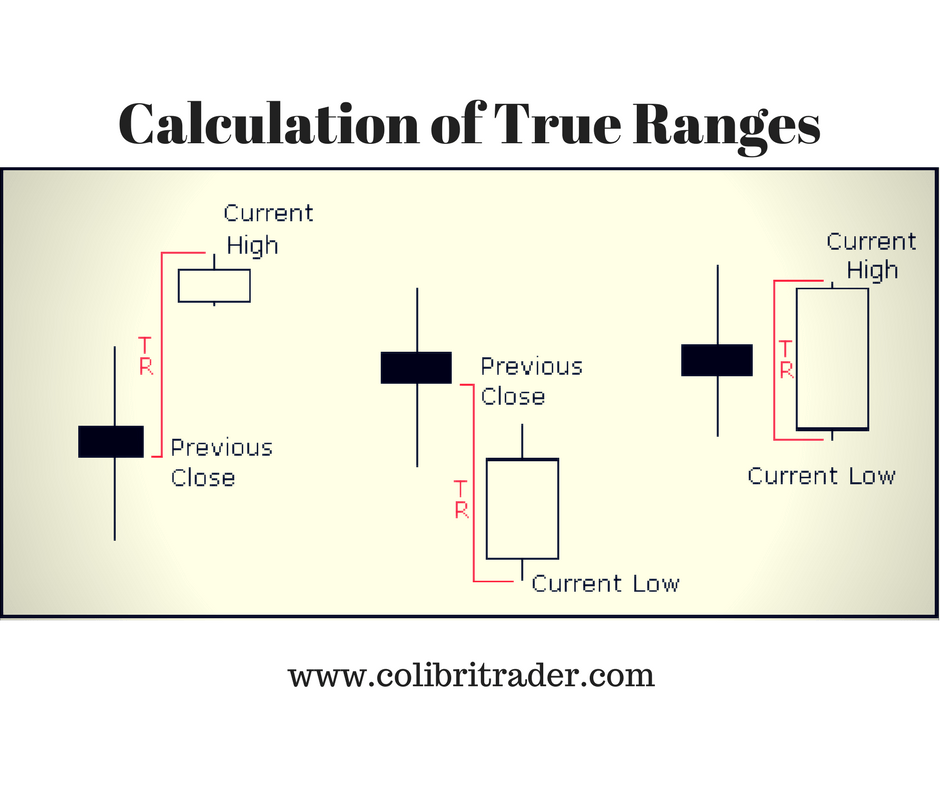
In the graphic above, the first price pattern shows a gap from the previous Close, and method (b) will be used for the True Range calculation. The second price pattern shows a gap to the downside, and therefore method (c) will be used. The third price patter shows an engulfing candlestick, with highs and lows outside the previous bar. Method (a) calculates the True Range in this case.
As said before, the recommended period for the ATR indicator is 14 days. This means, the value of the ATR will simply be the moving average of the 14 previous days.
Based on this statement, the acutal ATR is calculated using the following formula:
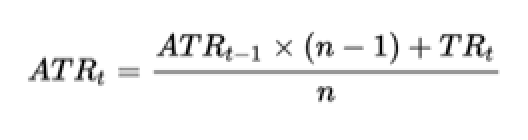
The current ATR value is equal to the previous ATR value multiplied with period-1, and added to the current True Range value. The result is then divided by the current period.
As we need a beginning value for the ATR, the ATR for the first 14 periods (assuming our ATR period is 14 days), is simply the average of the sums of True Ranges for the first 14 periods. The actual ATR formula shown above is used on the beginning of period 15.
Let’s take an example of the EUR/GBP currency pair:
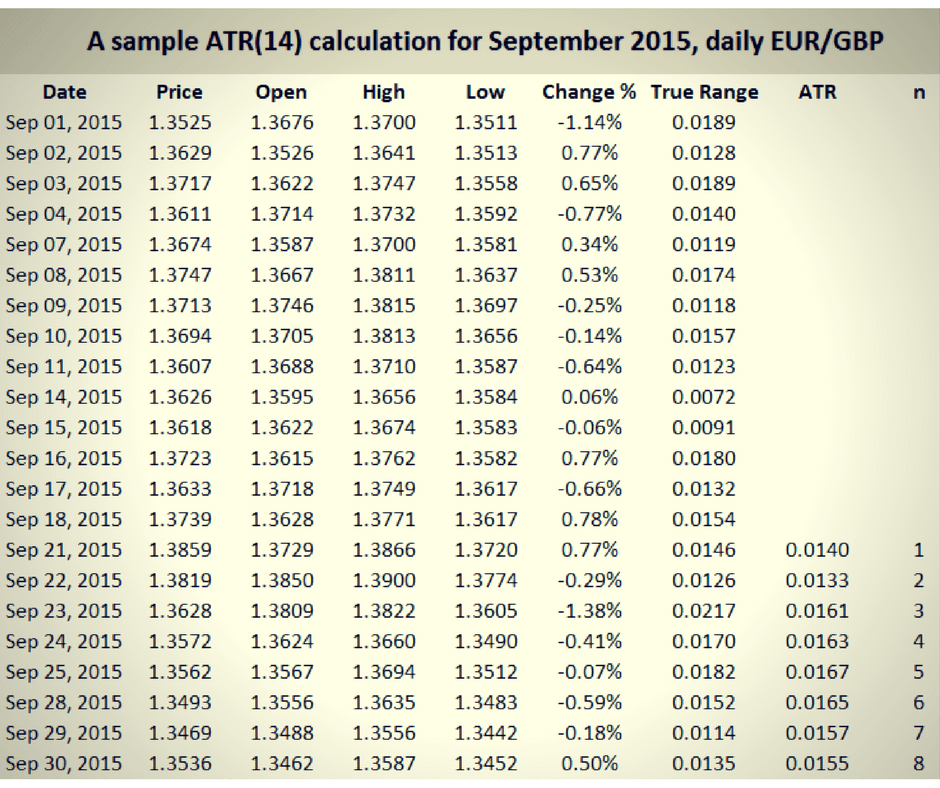
As can be seen on the above graphic, the True Ranges for the first 14 periods is calculated using one of the three mentioned methods above (a, b or c), and the actual ATR formula is used beginning of the 15th period. Although this is a relatively small sample, the purpose is purely to demonstrate the calculation of the ATR.
ATR is widely used for position-sizing. A currency pair (or other financial instrument) with a higher volatility and higher ATR, will require a larger stop-loss level than a currency pair with a lower ATR. The usual stop-loss level determined by this strategy is the current ATR level. Putting a stop-loss which is too large on a currency pair which has a low ATR, would create unnecessary risk for the trader. The opposite applies to currency pairs with high ATR readings. In this case the used stop-loss and take-profit levels should also be wider, as the position is on risk to be closed too early due to price volatility.
In general, the greater the ATR for a currency pair the wider the stop-loss level should be.
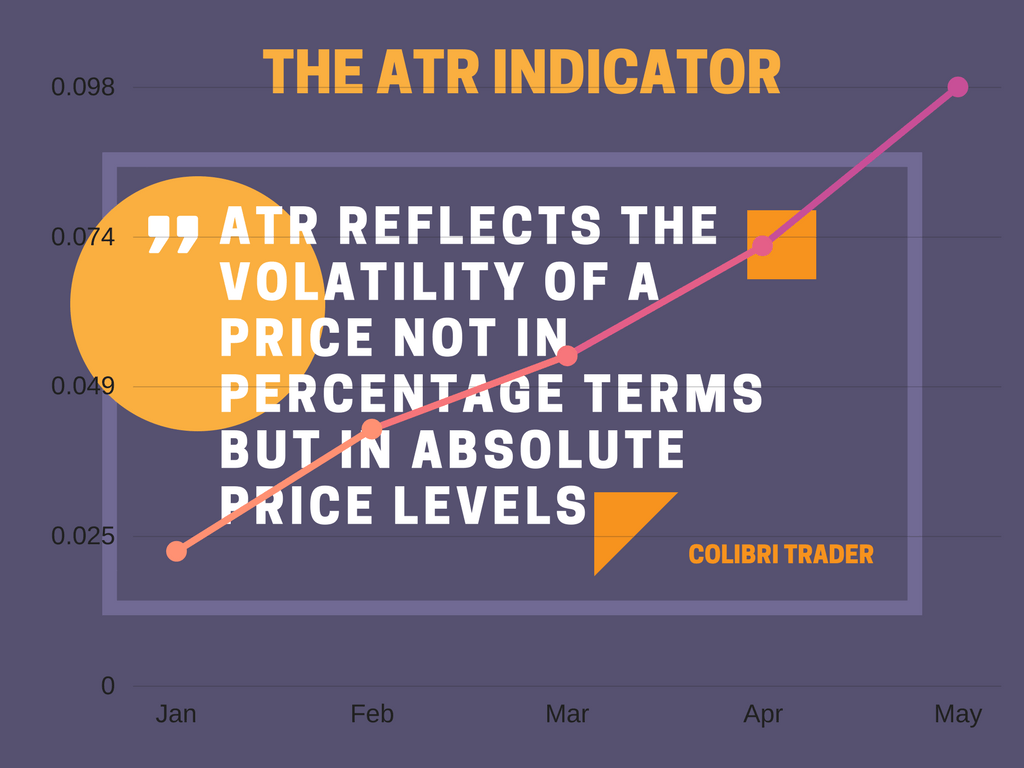
As ATR uses True Ranges for its calculation, which are in turn based on absolute price changes, ATR reflects the volatility of a price not in percentage terms but in absolute price levels. This means, a currency pair which usually has a high exchange rate (like GBP/JPY for example), will also have a higher ATR than a currency pair which trades on a lower exchange rate. These makes ATR comparisons between different currency pairs nearly impossible.
EXAMPLES:
#1 DAX Example
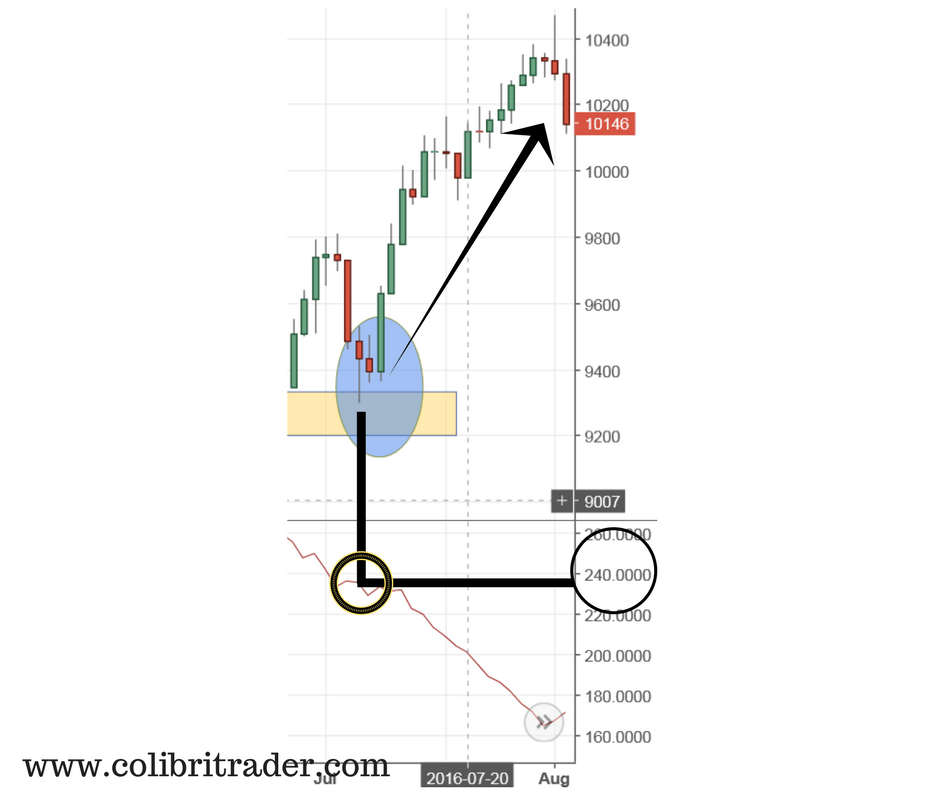
Let’s say you are going to execute a long trade at a certain point. You use the ATR indicator when determining where to place a stop-loss. Depending on which currency pair (or other instruement) you are trading, your stop-loss is a miltiple of the ATR. Let’s have a look at a specific example. This example is taken from a long entry on DAX. Let’s say that you enter in al ong trade at the circled area. Where would you place your stop-loss? Different traders use different settings, but a common approach is to take 1.5Xmultiple of the current ATR indicator reading. In the example below, the current ATR reading is 240. A trader using a 1.5X multiple willplace a stop-loss at 1.5x 240= 360 pips.
#2 EURUSD Example
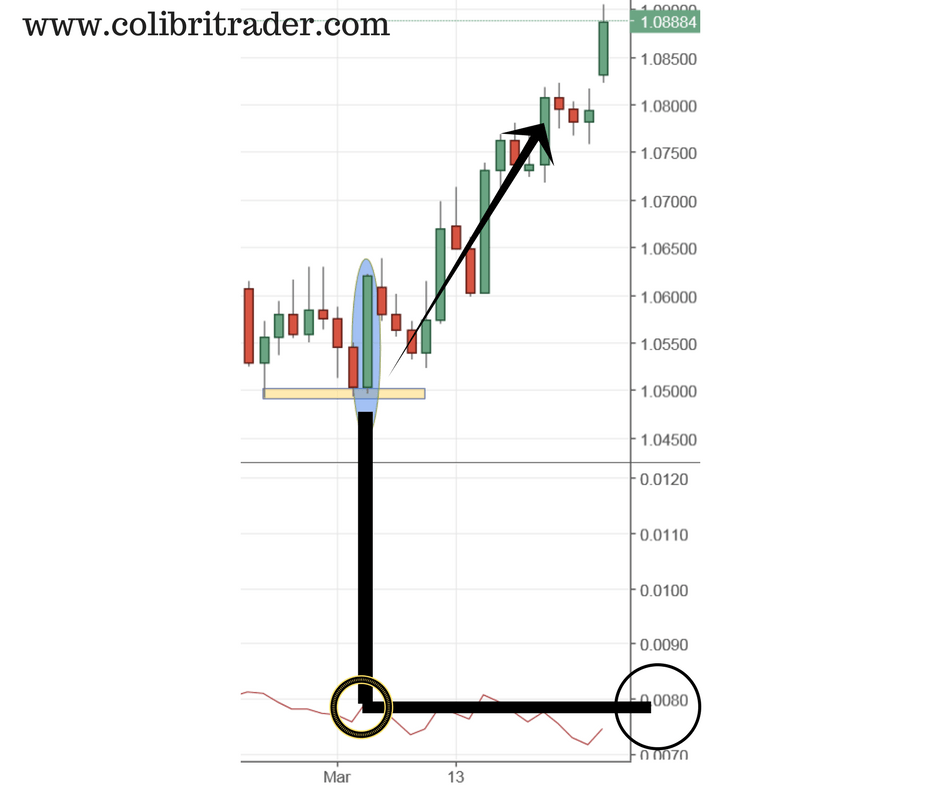
In the second example, there is the EURUSD daily chart. Let’s say that in the beginning of march, we took this trade that is encircled. At the time of the trade, the ATR value was about 0.0080, which is the equivalent of 80 pips. Let’s say that you wanted to place a stop-loss- how much would have been that if you were using 1.5x multiplier? Yes, that would be exactly 120 pips. You need to experiement and see which vlaues work best for the instruments that you are trading.
#3 AUDUSD Example
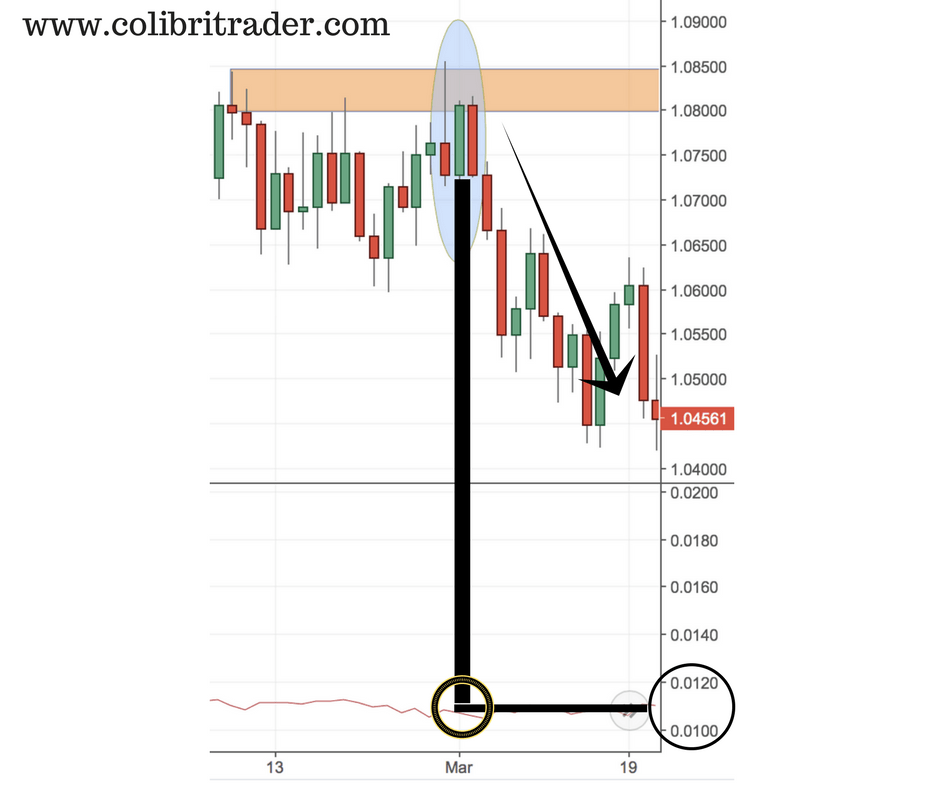
In the last example, I am showing a short trade on the AUDUSD. The ATR Indicator is showing a reading of 110 pips. You can see that the encircled area is between 0.0100 and 0.0120. This means that if a trader is about to take a short trade (and consider the 1.5X multiplier), the stop-loss should be placed 1.5x110pips= 165 pips away. In order to find a right combination, a trader must backtest and see what works best for a particular instrument. Therefore, it is essential that a lot of experimentation is performed before successful implementation.
Conclusion
The Average True Range is a highly popular technical indicator which measures price volatility. ATR does not take into account the price direction, but can be useful in case of major bullish or bearish reversals. A growing ATR value just after the start of a potential reversal might be used as a confirmation signal. ATR indicator is widely used for risk calcualtions and position sizing. A currency pair with higher ATR readings require wider stops to be used, as price volatility can easily close an initially profitable position.
Author

Colibri Trader
Colibri Trader
Colibri Trader, as he is known in the circles, is based in London, UK. He Started his career in one of the leading prop trading houses at the time and then has moved out to form his own company- Colibri Trader Limited.


