![]() Sam Seiden
Sam Seiden
Independent Analyst
The past few weeks, market volatility has been sky high. I can’t remember the last time the NASDAQ had more 50 – 100-point swings so often. Very strong supply and demand levels and huge profit zones are the norm ever since the market declined to the February lows. So often in the trading world, I hear people talk about where price is likely to turn next and how high or low it can go. The question I hardly ever hear anyone asking is, ‘Where is the next big profit zone?’ This is one of, if not the, most important things to consider when speculating in markets.
The profit zone is the distance in price between the entry point and the profit target price. When looking for trading opportunities, people tend to focus on where the next big turn in price will happen. As I often write about, these turns happen at price levels where supply and demand is out of balance. When looking at charts, you will find that there are many supply and demand levels. By no means are we interested in taking trading opportunities at all the levels we find. In fact, when considering profit zone into the filtering mix, we would ignore most of the supply and demand levels we find and narrow our focus down to the quality supply and demand levels that have large profit zones associated with them.
To explain the concept of profit zone and its importance in trading, let’s take a look at a trading opportunity from a recent live trading session I held last week for our students. Notice the demand zone on the chart (yellow box). Price gaps higher from that level for one reason, demand greatly exceeded supply. Price gaps higher because there was too much demand at that area and no sellers. Price had to travel higher to find sellers (the gap). All this price action is taking place in the box area on the chart.
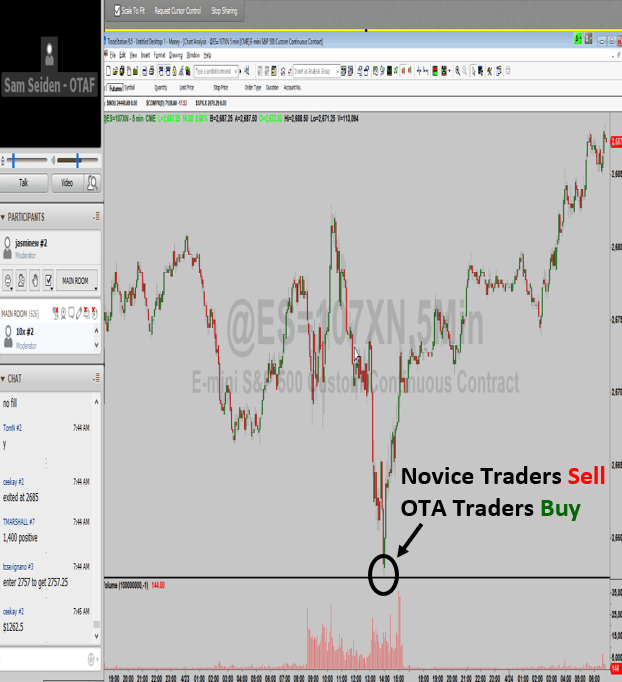
Follow my logic here… If there was no supply on the way up, forming the gap, then there will be little demand on the way back down to the demand zone, as seen on the chart. The chart suggested that banks were big buyers, but at the origin of the gap, not higher. The boxed area on the chart becomes the ‘profit zone’; which means there are very few unfilled buy or sell orders to stop price from moving through that area. The trading opportunity was to buy at the demand level and profit from a rally in price, which happened and can be seen on the second chart.
Live Trading Buy Setup: S&P – The Setup
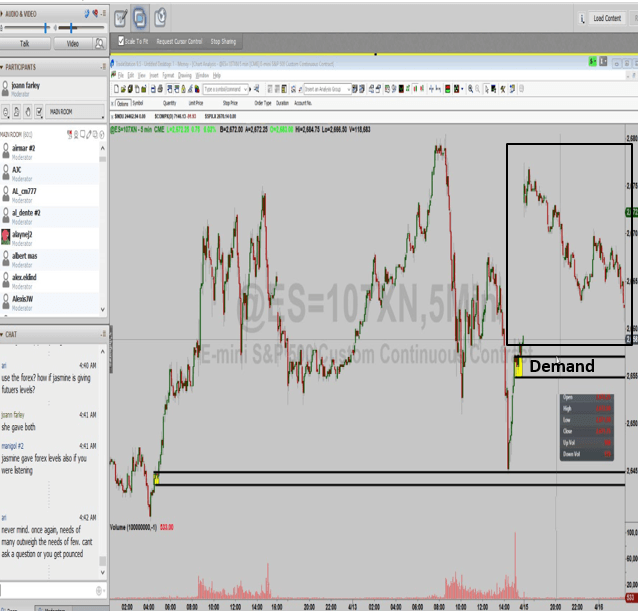
The key element here is to identify where the demand and supply is, then look at current price and determine the path of least resistance as that is where the next move in price is likely to go. Meaning, price is likely to have a relatively easy time moving through that boxed area, the profit zone, because there are no big sell orders to stop it; the price action tells us this in advance. Keep in mind a VERY important point here: We are following rules and coming to all these conclusions BEFORE we enter the trade. You must perform your analysis in advance and make your decisions before it’s time to push the button or this will never work.
Live Trading Buy Setup: S&P – The Result (4/23/18)
As I mentioned earlier, there are many supply and demand levels on a chart and many large and small profit margins. The key for the astute trader is to be able to identify objective supply and demand levels. Then, and only then, will you be able to find supply and demand levels that have huge profit zones associated with them.
What I do is ignore most supply and demand levels on a chart and only focus on the ones that have a great distance (huge profit zone) between them. This does two things. First, it obviously offers an attractive risk /reward opportunity. Second and just as important, the larger the profit zone, the greater the probability of the trade working out. This is because when you have a big profit zone, by definition your supply and demand levels are far out on the supply and demand curve. Entering your trades at market price extremes increases the probability of success.
To better understand the concept of profit zone in trading, think of profit margins in any other business. Think of how companies who sell products determine what to sell. Most of the decision, if not all of it, comes down to profit margin. Think about companies who produce products and how they decide what to produce. Most, if not all of that decision comes down to profit margin. The decision on which trading opportunities to put your hard-earned money at risk on is absolutely no different and, in fact, we chart profit margin the same way as any successful company would. Watch for the large major market profit zones to continue in the coming weeks.
Note: All information on this page is subject to change. The use of this website constitutes acceptance of our user agreement. Please read our privacy policy and legal disclaimer. Opinions expressed at FXstreet.com are those of the individual authors and do not necessarily represent the opinion of FXstreet.com or its management. Risk Disclosure: Trading foreign exchange on margin carries a high level of risk, and may not be suitable for all investors. The high degree of leverage can work against you as well as for you. Before deciding to invest in foreign exchange you should carefully consider your investment objectives, level of experience, and risk appetite. The possibility exists that you could sustain a loss of some or all of your initial investment and therefore you should not invest money that you cannot afford to lose. You should be aware of all the risks associated with foreign exchange trading, and seek advice from an independent financial advisor if you have any doubts.
Editors’ Picks

EUR/USD trims gains, back below 1.1800
EUR/USD now loses some upside momentum, returning to the area below the 1.1800 support as the Greenback manages to regain some composure following the SCOTUS-led pullback earlier in the session.

GBP/USD off highs, recedes to the sub-1.3500 area
Following earlier highs north of 1.3500 the figure, GBP/USD now faces some renewed downside pressure, revisiting the 1.3490 zone as the US Dollar manages to regain some upside impulse in the latter part of the NA session on Friday.

USD/JPY sticks to gains above 155.00, over one-week top ahead of US data
The USD/JPY pair gains positive traction for the third straight day and climbs to over a one-week top, around the 155.35-155.40 region. Data released early today showed that Japan’s key inflation gauge eased to the slowest pace in two years, tempering expectations for an immediate policy tightening by the Bank of Japan.
Editors’ Picks

EUR/USD: US Dollar comeback in the makes? Premium
The US Dollar (USD) stands victorious at the end of another week, with the EUR/USD pair trading near a four-week low of 1.1742, while the USD retains its strength despite some discouraging American data released at the end of the week.

Gold: Escalating geopolitical tensions help limit losses Premium
Gold (XAU/USD) struggled to make a decisive move in either direction this week as it quickly recovered above $5,000 after posting losses on Monday and Tuesday.

GBP/USD: Pound Sterling braces for more pain, as 200-day SMA tested Premium
The Pound Sterling (GBP) crashed to its lowest level in a month against the US Dollar (USD), as critical support levels were breached in a data-packed week.

Bitcoin: No recovery in sight
Bitcoin (BTC) price continues to trade within a range-bound zone, hovering around $67,000 at the time of writing on Friday, and falling slightly so far this week, with no signs of recovery.

US Dollar: Tariffed. Now What? Premium
The US Dollar (USD) reversed its previous week’s decline, managing to stage a meaningful rebound and retesting the area just above the 98.00 barrier when tracked by the US Dollar Index (DXY).
RECOMMENDED LESSONS
Making money in forex is easy if you know how the bankers trade!
I’m often mystified in my educational forex articles why so many traders struggle to make consistent money out of forex trading. The answer has more to do with what they don’t know than what they do know. After working in investment banks for 20 years many of which were as a Chief trader its second knowledge how to extract cash out of the market.
5 Forex News Events You Need To Know
In the fast moving world of currency markets where huge moves can seemingly come from nowhere, it is extremely important for new traders to learn about the various economic indicators and forex news events and releases that shape the markets. Indeed, quickly getting a handle on which data to look out for, what it means, and how to trade it can see new traders quickly become far more profitable and sets up the road to long term success.
Top 10 Chart Patterns Every Trader Should Know
Chart patterns are one of the most effective trading tools for a trader. They are pure price-action, and form on the basis of underlying buying and selling pressure. Chart patterns have a proven track-record, and traders use them to identify continuation or reversal signals, to open positions and identify price targets.
7 Ways to Avoid Forex Scams
The forex industry is recently seeing more and more scams. Here are 7 ways to avoid losing your money in such scams: Forex scams are becoming frequent. Michael Greenberg reports on luxurious expenses, including a submarine bought from the money taken from forex traders. Here’s another report of a forex fraud. So, how can we avoid falling in such forex scams?
What Are the 10 Fatal Mistakes Traders Make
Trading is exciting. Trading is hard. Trading is extremely hard. Some say that it takes more than 10,000 hours to master. Others believe that trading is the way to quick riches. They might be both wrong. What is important to know that no matter how experienced you are, mistakes will be part of the trading process.
The challenge: Timing the market and trader psychology
Successful trading often comes down to timing – entering and exiting trades at the right moments. Yet timing the market is notoriously difficult, largely because human psychology can derail even the best plans. Two powerful emotions in particular – fear and greed – tend to drive trading decisions off course.