![]() Rick Wright
Rick Wright
Online Trading Academy
Hello traders! This week’s newsletter will be discussing how to add to your winning trades properly.
I’m sure by now most of you have heard some of the tired old phrases in trading like; let your winners run (true); cut your losses quickly (true); the trend is your friend until the bend at the end (true); trading is a zero-sum game (false); but there are a couple of phrases that most haven’t heard, and some of them could save you from losses.
The first is, amateurs go broke by taking large losses. This is VERY true. Most new/amateur traders are very quick to take their profits, showing a fear of giving back any small gains. Imagine you are up 20 pips, yet your target was 100 pips away. Perhaps you had a PLANNED reward to risk ratio of 3:1, but as your 20 pip profit slowly deteriorated to 15, 10, then only 5 pips you quickly closed your trade. This is taking a small profit, yes, but it will affect your REALIZED reward to risk ratio. New or amateur traders will also often let their losing trades approach their stop loss, yet, instead of taking the small loss they will move the stop farther away a few pips! So, instead of a 30 pip loss they wind up with a 40, 50 or even a 100 pip loss! This will cause amateur traders to go broke very quickly.
The second phrase most haven’t heard is, professional traders go broke taking small profits. This means that an experienced, profitable trader may be making a few pips on a weekly basis, but is it enough to finance their lifestyle? In my 22+ years of trading and teaching, I’ve met hundreds of traders who make a few pips a week. Which basically means they are trading on the side. So, assuming everyone wants to make more pips, let’s discuss one way to do that.
So, now it’s time to talk about how to add to our winners…almost. First, I need to show you how NOT to add to winners. For simplicity’s sake, I’m going to just use basic math, then we’ll get to the chart.
Imagine you buy something at $10, with the expectation it will go to $20, and your stop loss is at $9. You buy 1 lot. Price moves up to $13, pulls back to $12, then you buy 2 MORE, and you adjust your stop to say, $11. Your average price is now $11.33!, ((1×10) + (2×12))/3=11.33. Do you see how close your cost/price is to your stop?!As you add more lots at each new pullback it is possible to add incorrectly (buy 1, then buy 2 to have 3, then buy 3 to have 6, etc.), causing your average cost or price to end up being TOO CLOSE to your stop loss. One quick move in price the wrong way will take you out of the trade, very often for a loss, which I don’t think is the plan. So, how should you add to a winner?
How to Maximize Trading Profits
When adding to a trade to maximize profits, the goal is to avoid calculation errors by keeping the math relatively simple. By starting with one lot, then only adding 1 lot, going the right way, every time you add to the trade, you accomplish that goal.
Another way to increase your winnings on a trade while keeping the math simple is, for example, if you started with 4 lots, then you add 3, then add 2, then 1, then 1, then 1….until you finally get stopped out.
Rules for Adjusting Your Stop Loss
For long trades:
-
After each add to a WINNING TRADE (we never add to losers), adjust your stop loss size to the new current position size.
-
Make sure your stop loss is ABOVE the average cost/price of the total trade. Your brokerage firm will show you what your average price is. Why above? Because if the price does reverse, you want to guarantee at least a few pips.
For short trades:
-
After each add to a WINNING TRADE, adjust your stop loss size to the new current position size.
-
Make sure your stop loss is BELOW the average cost of the total trade.
Additional Rules for Adding to Winning Trades
Some traders have success with this technique WITHOUT placing a profit target in their platform, only having s stop loss. However, when looking at your charts, to be successful, this trade must have a potential of much more than a 3:1…very often, a 10:1 is a possibility from your first entry! This basically means these trades don’t show up every few minutes.
Another potential rule to follow is to only start this trade technique AFTER a longer term trend has broken, and it looks like a NEW trend has begun. This ties back into the just mentioned rule above.
Here is what it could have looked like on the USDJPY 120 minute chart:
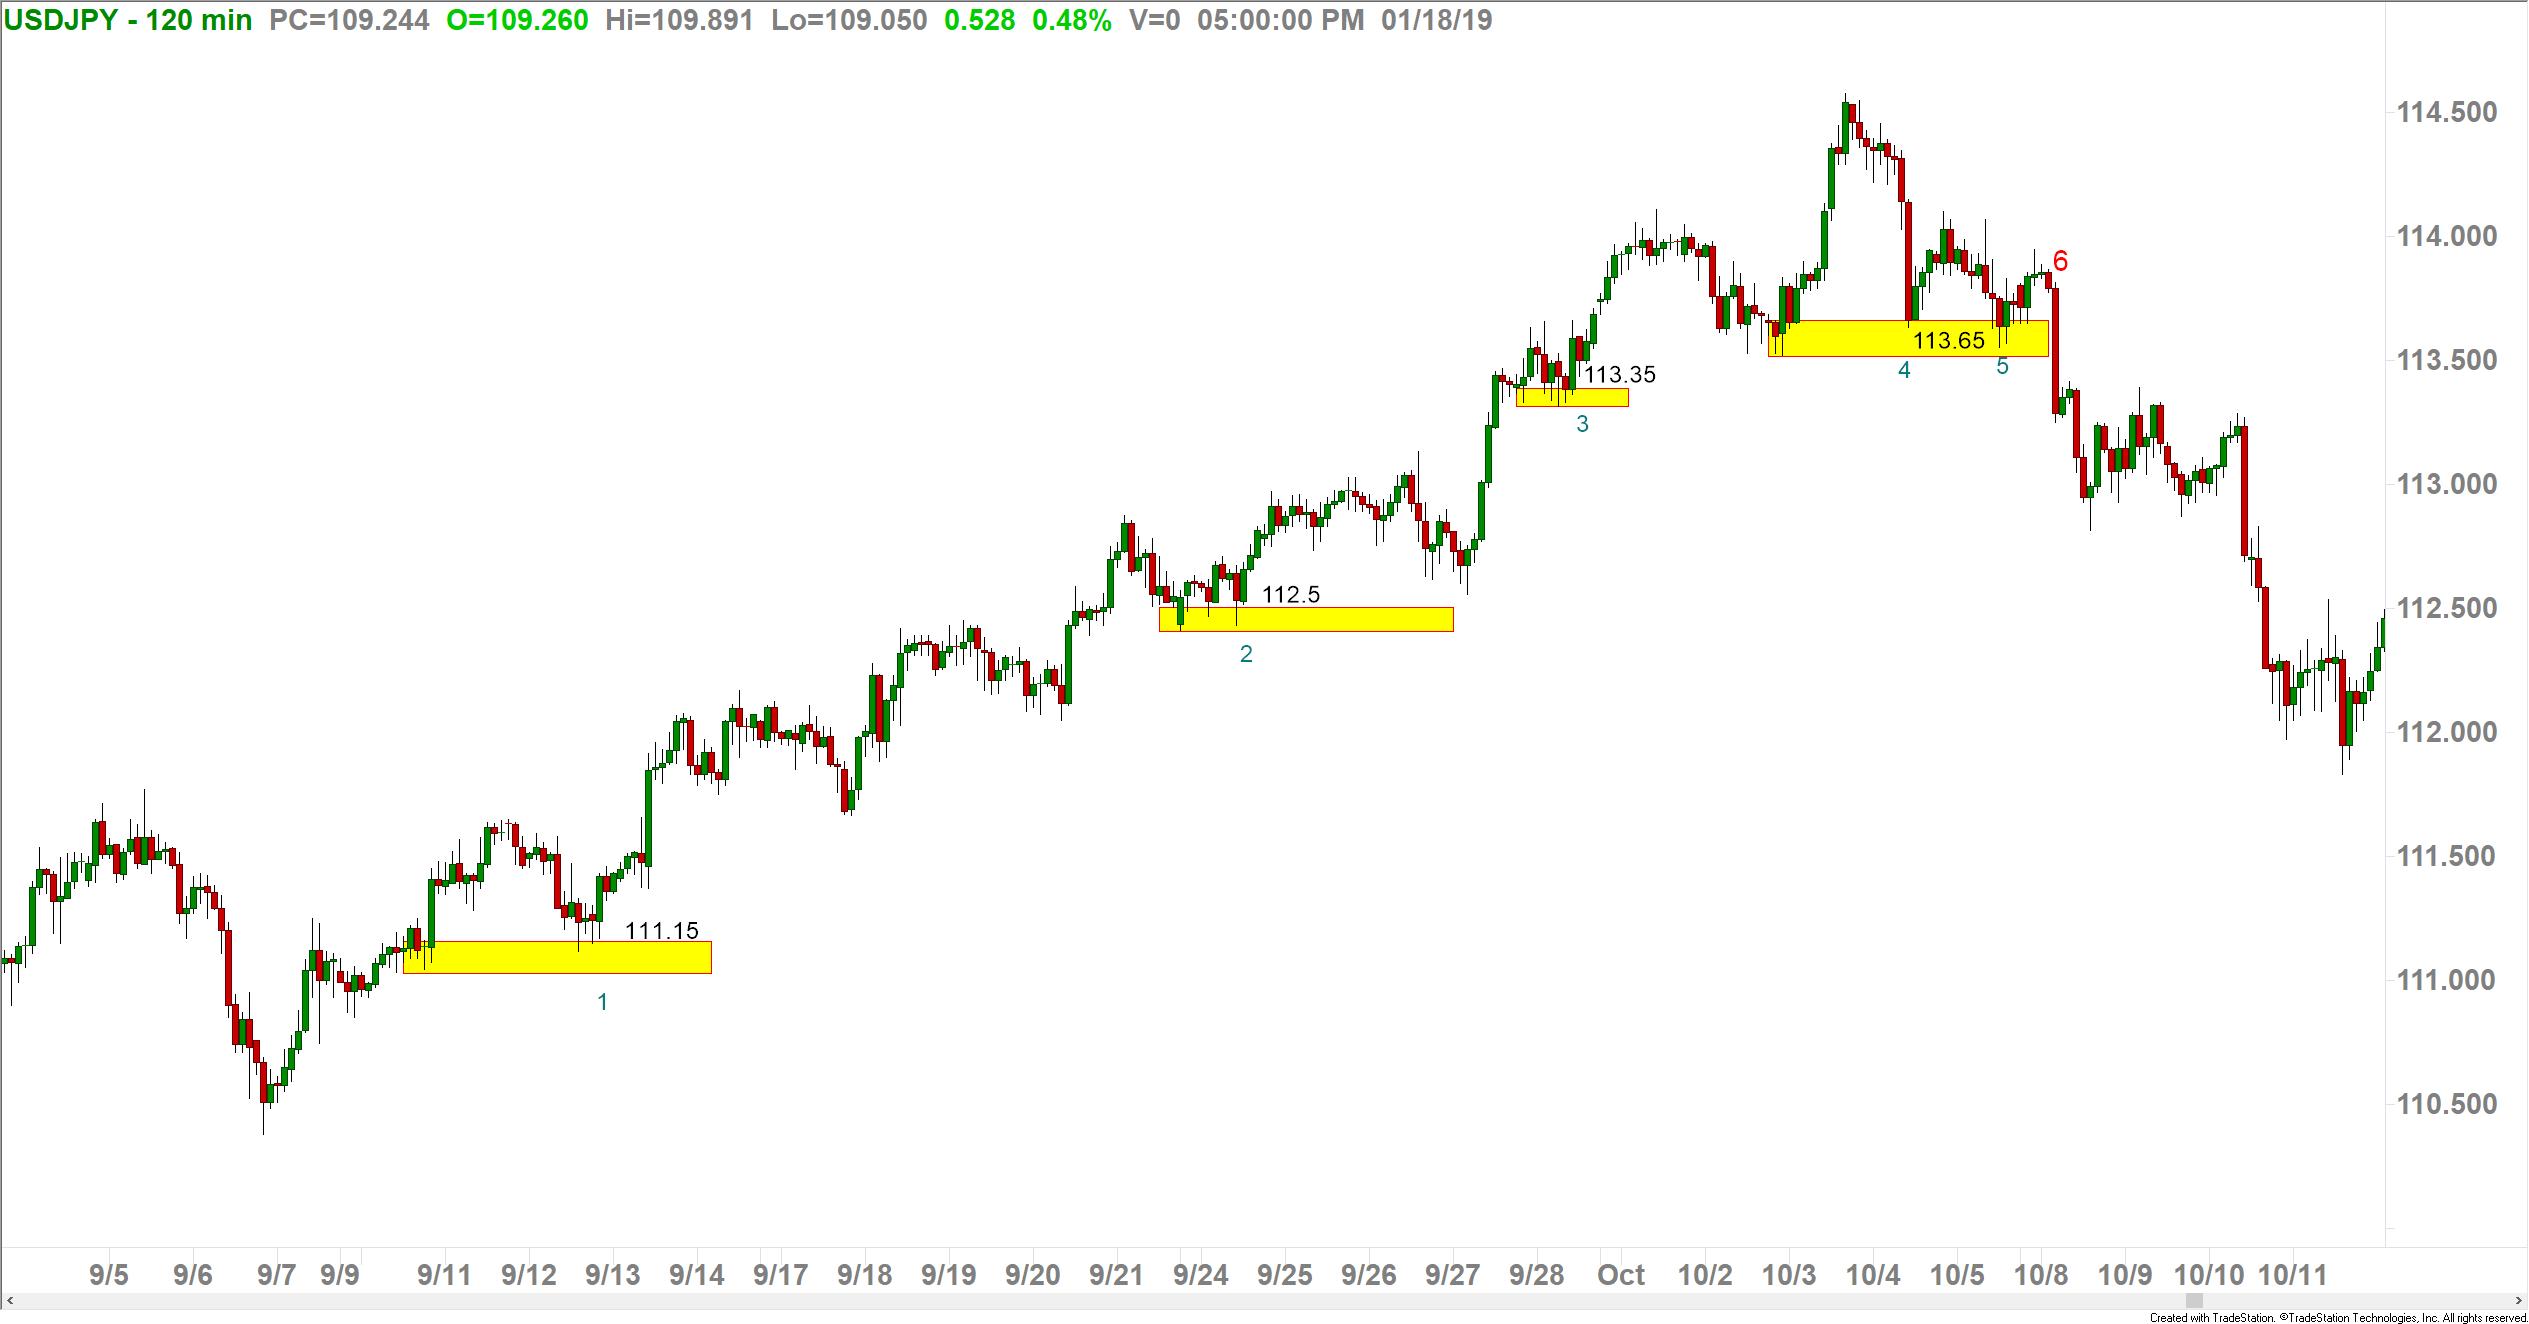
At the lowest yellow demand zone, green 1, an entry buy order could have been place at 111.15. As price is moving your direction over the next couple of days, you should have moved your stop loss first to break even, then up to lock in a few pips. This has not been marked on this chart for clarity’s sake.
At the next yellow demand zone, green 2, an entry buy order could have been placed at 112.50, bringing your average cost to 111.825. Your stop now should be ABOVE the average cost of 111.825, but BELOW the demand zone you just used for entry. Again, not marked on chart, but the stop price would be approximately 112.35.
At the next yellow demand zone, green 3, an entry buy order could have been place at 113.35, bringing your average cost to 112.33. Your stop should now be ABOVE the average cost of 112.33, but BELOW the demand zone you just used for entry. Not marked, but it should be approximately 113.25.
At the next yellow demand zone, green 4, an entry order could have been placed at 113.65, bringing your average cost to 112.66. Your stop loss should now be ABOVE the average cost of 112.66, but BELOW the demand zone you just used for entry. Not marked, but it should be approximately 113.35.
Notice the same demand zone, but where the green 5 is located. Personally, I won’t add to a winning trade in THE SAME ZONE as where I just added. Spot 4 makes sense to add; spot 5 would be in the same zone so it does not make sense to add to your trade here.
At the large red candle under the red 6, we should have been taken out of our trade, around our 113.35 stop loss.
When done properly, the only time you can take a loss on this position is when you first enter the trade! If the zone at 1 hadn’t held we would have taken a small loss. However, when we add to our trade following this strategy and adjust our stop loss according to the rules, in normal markets our stop loss will only be locking in profits along the way! Now, you must be aware that this refers to the ENTIRE position; we will ALWAYS take a loss on the LAST ADD to this position. This is another reason we don’t add to our trades with the 1 + 2 =3 +3=6 technique. If we KNOW our last add will be a loss, why would we have that loss be on a large portion of our entire position?
Using core strategy techniques, current students of Online Trading Academy should be able to spot a couple more entry points on this chart, however, this example has been done with simplicity in mind. Hopefully this new technique will bring you a few more pips in 2019!
Read the original article here - Are You Adding to Your Winning Trades?
This content is intended to provide educational information only. This information should not be construed as individual or customized legal, tax, financial or investment services. As each individual's situation is unique, a qualified professional should be consulted before making legal, tax, financial and investment decisions. The educational information provided in this article does not comprise any course or a part of any course that may be used as an educational credit for any certification purpose and will not prepare any User to be accredited for any licenses in any industry and will not prepare any User to get a job. Reproduced by permission from OTAcademy.com click here for Terms of Use: https://www.otacademy.com/about/terms
Editors’ Picks

EUR/USD trims gains, hovers around 1.1900 post-US data
EUR/USD trades slightly on the back foot around the 1.1900 region in a context dominated by the resurgence of some buying interest around the US Dollar on turnaround Tuesday. Looking at the US docket, Retail Sales disappointed expectations in December, while the ADP 4-Week Average came in at 6.5K.

GBP/USD comes under pressure near 1.3680
The better tone in the Greenback hurts the risk-linked complex on Tuesday, prompting GBP/USD to set aside two consecutive days of gains and trade slightly on the defensive below the 1.3700 mark. Investors, in the meantime, keep their attention on key UK data due later in the week.

USD/JPY drops toward 155.00 as focus shifts to US data
USD/JPY meets fresh supply and inches closer toward 155.00 in the Asian session on Tuesday. The Japanese Yen holds the upper hand over the US Dollar after Japanese Prime Minister Sanae Takaichi led the ruling Liberal Democratic Party to a historic landslide win and on intervention talks. Traders brace for key US economic data that could offer more clues on the Federal Reserve's monetary policy.
Editors’ Picks
EUR/USD trims gains, hovers around 1.1900 post-US data
EUR/USD trades slightly on the back foot around the 1.1900 region in a context dominated by the resurgence of some buying interest around the US Dollar on turnaround Tuesday. Looking at the US docket, Retail Sales disappointed expectations in December, while the ADP 4-Week Average came in at 6.5K.
GBP/USD comes under pressure near 1.3680
The better tone in the Greenback hurts the risk-linked complex on Tuesday, prompting GBP/USD to set aside two consecutive days of gains and trade slightly on the defensive below the 1.3700 mark. Investors, in the meantime, keep their attention on key UK data due later in the week.

Gold loses some traction, still above $5,000
Gold faces some selling pressure on Tuesday, surrendering part of its recent two-day advance although managing to keep the trade above the $5,000 mark per troy ounce. The daily pullback in the precious metal comes in response to the modest rebound in the US Dollar, while declining US Treasury yields across the curve seem to limit the downside.

XRP holds $1.40 amid ETF inflows and stable derivatives market
Ripple trades under pressure, with immediate support at $1.40 holding at the time of writing on Tuesday. A recovery attempt from last week’s sell-off to $1.12 stalled at $1.54 on Friday, leading to limited price action between the current support and the resistance.

Dollar drops and stocks rally: The week of reckoning for US economic data
Following a sizeable move lower in US technology Stocks last week, we have witnessed a meaningful recovery unfold. The USD Index is in a concerning position; the monthly price continues to hold the south channel support.
RECOMMENDED LESSONS
Making money in forex is easy if you know how the bankers trade!
I’m often mystified in my educational forex articles why so many traders struggle to make consistent money out of forex trading. The answer has more to do with what they don’t know than what they do know. After working in investment banks for 20 years many of which were as a Chief trader its second knowledge how to extract cash out of the market.
5 Forex News Events You Need To Know
In the fast moving world of currency markets where huge moves can seemingly come from nowhere, it is extremely important for new traders to learn about the various economic indicators and forex news events and releases that shape the markets. Indeed, quickly getting a handle on which data to look out for, what it means, and how to trade it can see new traders quickly become far more profitable and sets up the road to long term success.
Top 10 Chart Patterns Every Trader Should Know
Chart patterns are one of the most effective trading tools for a trader. They are pure price-action, and form on the basis of underlying buying and selling pressure. Chart patterns have a proven track-record, and traders use them to identify continuation or reversal signals, to open positions and identify price targets.
7 Ways to Avoid Forex Scams
The forex industry is recently seeing more and more scams. Here are 7 ways to avoid losing your money in such scams: Forex scams are becoming frequent. Michael Greenberg reports on luxurious expenses, including a submarine bought from the money taken from forex traders. Here’s another report of a forex fraud. So, how can we avoid falling in such forex scams?
What Are the 10 Fatal Mistakes Traders Make
Trading is exciting. Trading is hard. Trading is extremely hard. Some say that it takes more than 10,000 hours to master. Others believe that trading is the way to quick riches. They might be both wrong. What is important to know that no matter how experienced you are, mistakes will be part of the trading process.
The challenge: Timing the market and trader psychology
Successful trading often comes down to timing – entering and exiting trades at the right moments. Yet timing the market is notoriously difficult, largely because human psychology can derail even the best plans. Two powerful emotions in particular – fear and greed – tend to drive trading decisions off course.