Firstly, triple three corrections are a sideways combination of three corrective patterns in Elliott Wave Theory. These corrections are one of the five types of corrective patterns that correct the completed cycle of the prevailing trend. Zigzags (5-3-5), Flats (3-3-5), Triangles (3-3-3-3-3), Double threes which are a combination of two corrective patterns previously mentioned. Then lastly a Triple three that is a combination of three corrective patterns mentioned above. That structure is the focus of this particular article.
Secondly here are some guidelines.  The corrective structures are labeled as WXYXZ. They are an 11 swing structure. The subdivision of wave W, wave Y, and wave Z can be a zigzag, a flat, a double three of smaller degree, or a triple three of smaller degree. The Wave X can be any corrective structure including a stand alone triangle.
The Fibonacci ratio relationships are as follows. Wave X will retrace anywhere from 50%, 61.8%, 76.4%, or 85.4% of wave W. Wave Y can not pass 161.8% of wave W or it can become an impulsive wave three. The second wave X will retrace the wave Y in the same aforementioned Fibonacci retracement levels as it did the wave W. The second wave X structure does not have be the same structure as the first wave X. The Wave Z target area to finish the triple three correction will be a Fibonacci extension 61.8%, 100%, or 123.6% of the wave W.
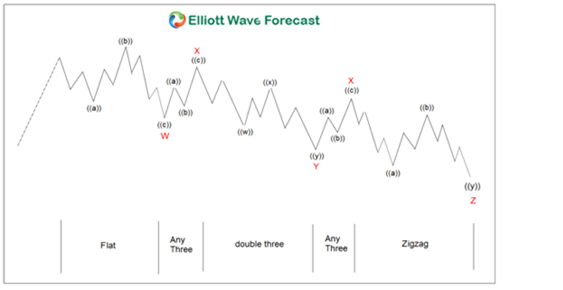
The graphic below is an example of three corrective structure combinations that can form triple three corrections. In this one wave W is an expanded flat with a zigzag connector first wave X. This is followed by a double three wave Y. The second wave X connector is a zigzag. Lastly the wave Z is also a zigzag. Continued below the graphics.

fxsoriginal

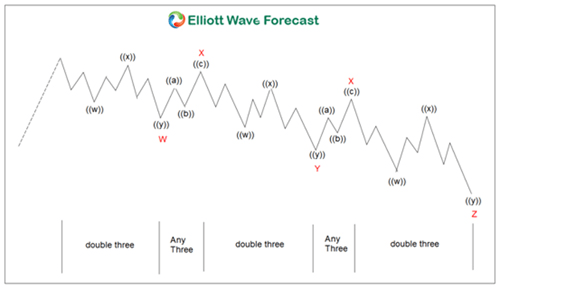
The graphic below is another example of three corrective structure combinations that can form triple three corrections. In the same fashion this particular one is a double three wave W followed by the first wave X being a zigzag. Likewise as the wave W, the wave Y is a double three. This is followed by a zigzag second wave X connector. The wave Z ends with another double three. Continued below the graphics.

fxsoriginal

In conclusion. As has been noted triple threes are a combination of three corrective patterns. They can occur in either a bearish trending market or as in the illustrations shown above a bullish trending market.


FURTHER DISCLOSURES AND DISCLAIMER CONCERNING RISK, RESPONSIBILITY AND LIABILITY Trading in the Foreign Exchange market is a challenging opportunity where above average returns are available for educated and experienced investors who are willing to take above average risk. However, before deciding to participate in Foreign Exchange (FX) trading, you should carefully consider your investment objectives, level of xperience and risk appetite. Do not invest or trade capital you cannot afford to lose. EME PROCESSING AND CONSULTING, LLC, THEIR REPRESENTATIVES, AND ANYONE WORKING FOR OR WITHIN WWW.ELLIOTTWAVE- FORECAST.COM is not responsible for any loss from any form of distributed advice, signal, analysis, or content. Again, we fully DISCLOSE to the Subscriber base that the Service as a whole, the individual Parties, Representatives, or owners shall not be liable to any and all Subscribers for any losses or damages as a result of any action taken by the Subscriber from any trade idea or signal posted on the website(s) distributed through any form of social-media, email, the website, and/or any other electronic, written, verbal, or future form of communication . All analysis, trading signals, trading recommendations, all charts, communicated interpretations of the wave counts, and all content from any media form produced by www.Elliottwave-forecast.com and/or the Representatives are solely the opinions and best efforts of the respective author(s). In general Forex instruments are highly leveraged, and traders can lose some or all of their initial margin funds. All content provided by www.Elliottwave-forecast.com is expressed in good faith and is intended to help Subscribers succeed in the marketplace, but it is never guaranteed. There is no “holy grail” to trading or forecasting the market and we are wrong sometimes like everyone else. Please understand and accept the risk involved when making any trading and/or investment decision. UNDERSTAND that all the content we provide is protected through copyright of EME PROCESSING AND CONSULTING, LLC. It is illegal to disseminate in any form of communication any part or all of our proprietary information without specific authorization. UNDERSTAND that you also agree to not allow persons that are not PAID SUBSCRIBERS to view any of the content not released publicly. IF YOU ARE FOUND TO BE IN VIOLATION OF THESE RESTRICTIONS you or your firm (as the Subscriber) will be charged fully with no discount for one year subscription to our Premium Plus Plan at $1,799.88 for EACH person or firm who received any of our content illegally through the respected intermediary’s (Subscriber in violation of terms) channel(s) of communication.

Editors’ Picks

EUR/USD climbs to daily highs near 1.1820

EUR/USD climbs to daily highs near 1.1820

EUR/USD now picks up pace and advances to the area of daily peaks north of the 1.1800 barrier at the end of the week. The pair’s decent move higher comes against the backdrop of a generalised lack of direction in the FX galaxy and the mild offered stance in the US Dollar.

GBP/USD trims losses, retests 1.3460

GBP/USD trims losses, retests 1.3460

After briefly challenging its key 200-day SMA near 1.3440, GBP/USD now manages to regain some balance and revisit the 1.3460 zone on Friday. Cable’s pullback comes as the selling pressure on the Greenback gathers traction, reigniting some recovery in the risk-linked space.

Japanese Yen gives back half of early gains against USD ahead of US PPI data

Japanese Yen gives back half of early gains against USD ahead of US PPI data

The Japanese Yen (JPY) surrenders half of its early gains against the US Dollar (USD) during the European trading session on Friday. The USD/JPY pair rebounds to near 155.90 as the JPY falls back, but is still 0.15% down.


Editors’ Picks

EUR/USD: Fed calm, ECB steady, but the Dollar still leads

EUR/USD: Fed calm, ECB steady, but the Dollar still leads Premium

EUR/USD is still struggling to find real traction. The pair has tried to stabilise, but momentum keeps fading, leaving the door open to further weakness.

Gold: Falling US yields, geopolitics help XAU/USD hold ground

Gold: Falling US yields, geopolitics help XAU/USD hold ground Premium

Gold (XAU/USD) gained traction and climbed above $5,200, ending the fourth consecutive week in positive territory. The next round of US-Iran talks and crucial macroeconomic data releases from the US will be watched closely by market participants in the short term.

GBP/USD: Will Pound Sterling defend key 1.3450 support ahead of US jobs data?

GBP/USD: Will Pound Sterling defend key 1.3450 support ahead of US jobs data? Premium

The Pound Sterling (GBP) entered a bearish consolidation phase against the US Dollar (USD), after having tested critical support near the 1.3450 level on several occasions.

Bitcoin: Another month of losses, and it’s been five

Bitcoin: Another month of losses, and it’s been five

Bitcoin (BTC) price is stabilizing around $68,000 at the time of writing on Friday, but the Crypto King is poised to close February on a fragile footing, marking its fifth consecutive month of losses since October and a rare start to the year with back-to-back monthly corrections.

US Dollar: At a crossroads; Fed steady, tariffs in flux

US Dollar: At a crossroads; Fed steady, tariffs in flux Premium

The US Dollar’s (USD) upward momentum from the previous week seems to have encountered a tough nut to crack in the 98.00 region, as measured by the US Dollar Index (DXY).

RECOMMENDED LESSONS

5 Forex News Events You Need To Know

In the fast moving world of currency markets where huge moves can seemingly come from nowhere, it is extremely important for new traders to learn about the various economic indicators and forex news events and releases that shape the markets. Indeed, quickly getting a handle on which data to look out for, what it means, and how to trade it can see new traders quickly become far more profitable and sets up the road to long term success.

Top 10 Chart Patterns Every Trader Should Know

Chart patterns are one of the most effective trading tools for a trader. They are pure price-action, and form on the basis of underlying buying and selling pressure. Chart patterns have a proven track-record, and traders use them to identify continuation or reversal signals, to open positions and identify price targets.

7 Ways to Avoid Forex Scams

The forex industry is recently seeing more and more scams. Here are 7 ways to avoid losing your money in such scams: Forex scams are becoming frequent. Michael Greenberg reports on luxurious expenses, including a submarine bought from the money taken from forex traders. Here’s another report of a forex fraud. So, how can we avoid falling in such forex scams?

What Are the 10 Fatal Mistakes Traders Make

Trading is exciting. Trading is hard. Trading is extremely hard. Some say that it takes more than 10,000 hours to master. Others believe that trading is the way to quick riches. They might be both wrong. What is important to know that no matter how experienced you are, mistakes will be part of the trading process.

Strategy

Money Management

Psychology

Best Brokers of 2025