![]() Gabe Velázquez
Gabe Velázquez
Online Trading Academy
Of all the facets of trading, the first that a new trader must learn to master before he can engage the markets with any degree of confidence is the identification of low risk entries on a price chart. Notice that not just any entry will do, only those offering the biggest reward for the least amount of loss potential will do. In addition, the probabilities have to stack up in a trader’s favor.
If you’ve ever read about or had the chance to meet a successful trader, you will find one common thread: They all (without exception) have an EDGE based on low risk entries and possess extreme discipline to execute their process.
What Defines a Low Risk Trade Entry?
I define a low risk trade entry as a price level where a trader can expose the least amount of capital to prove whether his edge will work. I tell students to look for these areas by identifying pockets of unfilled orders. These are generally found at prior inflection points or levels of equilibrium on a price chart. That is, points where is the market likely to change direction.
Specifically, inflection points can be spotted by looking for those price levels where there was a clear change of direction. In other words, where was the dominance of either the buyers or sellers relinquished? Moreover, the more powerful the reversal, the more important that point becomes on the retest. The chart below depicts a couple of these turning points in ES (S&P 500 E-mini futures).
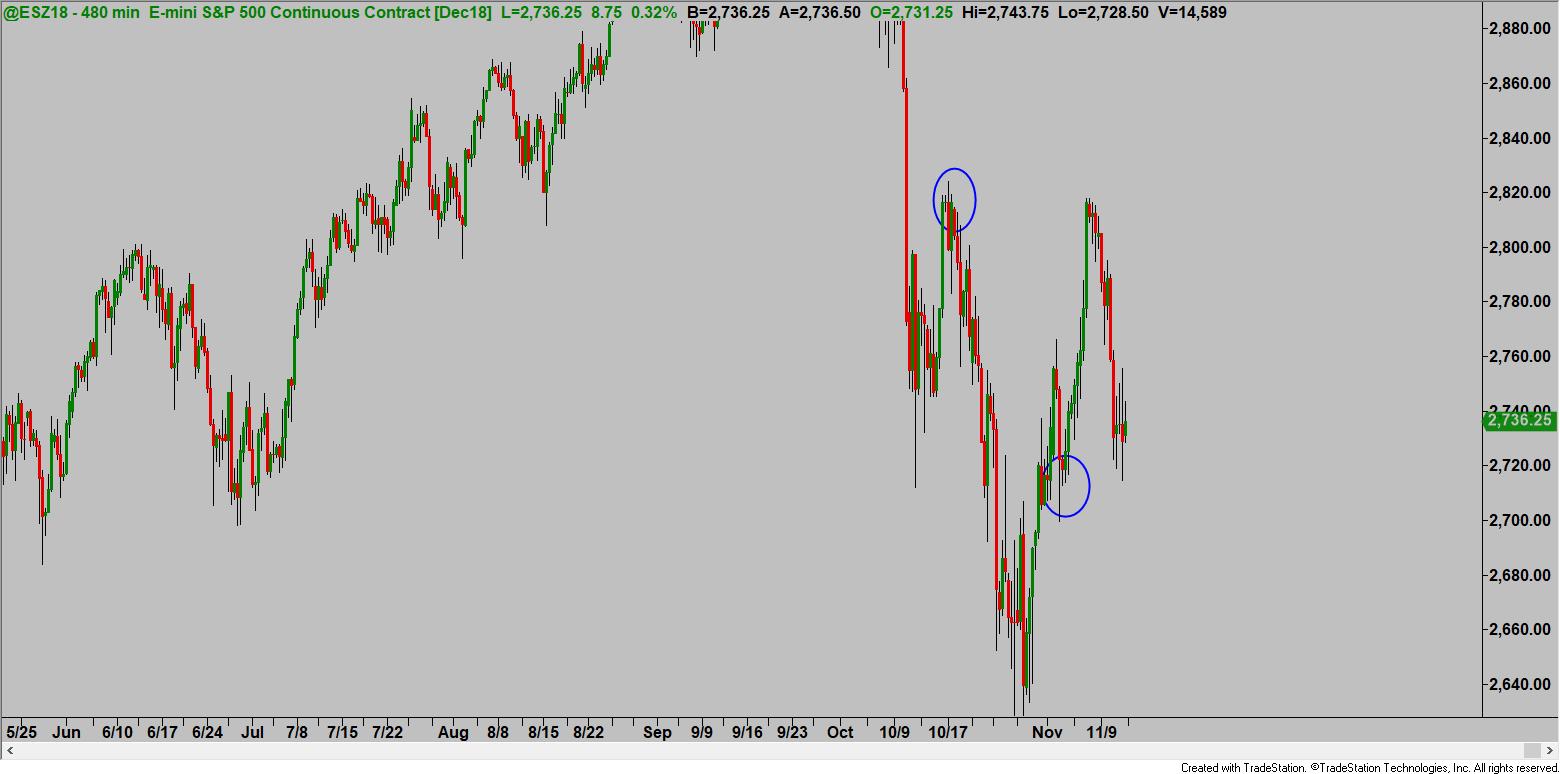
Also noteworthy is the fact that the first time these levels were tested, not only did they provide a low risk trade setup, but they also held and reversed a high percentage of the time.
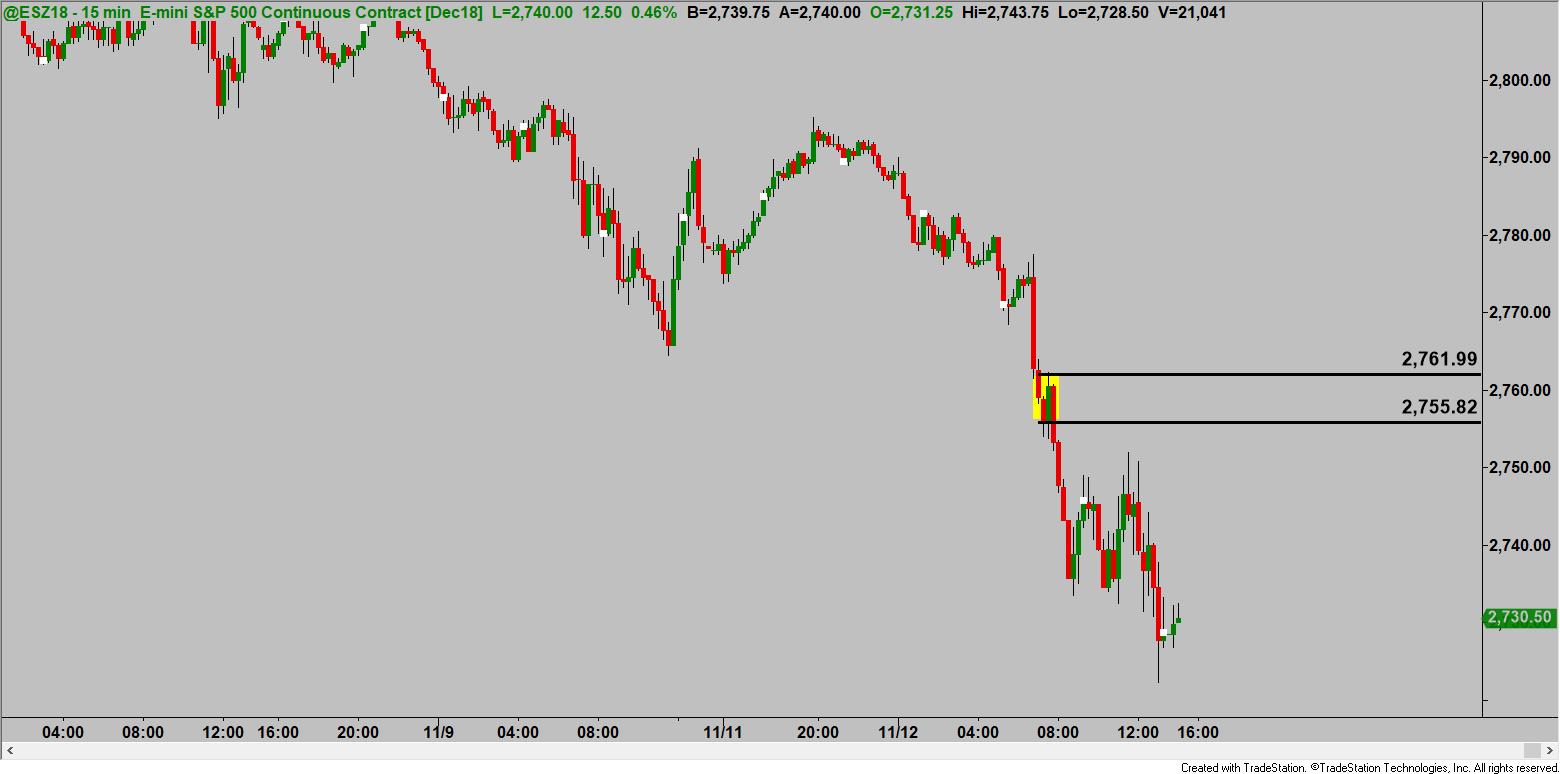
Also, when a move is underway, those aforementioned pockets of unfilled orders show up on a chart as a level of equilibrium, as we can see from the caption below.

As we can see in the chart, the level stopped the incipient rally and turned price lower. This caused the short trade to work nicely.
In the final two illustrations, I’m showing the before and after screenshot of a trade I set up for the students in the last Instructor Spotlight session I did early Tuesday, November 13. The rationale behind this trade was that the ES had been dropping (as seen by the big red candles shown in the prior chart) and inside the selling candles was a fresh supply zone. The trade was to wait for price to rally up to the Supply zone and expect it turn back down to an opposing demand zone (fresh buy orders).
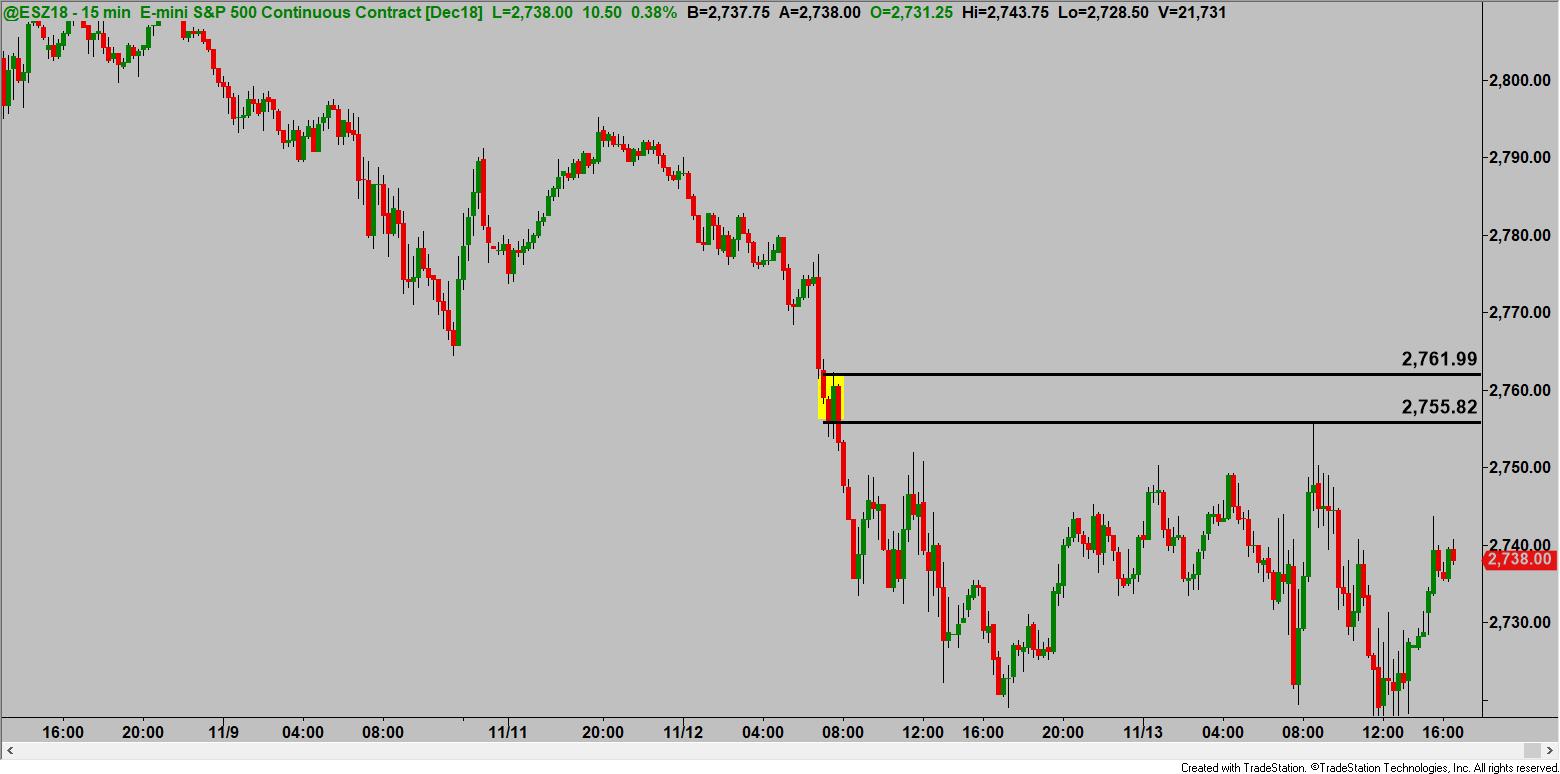
Suffice it to say, not all trades will work as well as these did, but the key here is when they don’t pan out, the losses will be small compared to the profit potential.
Once a trader learns the skill of identifying these levels, the biggest challenge is putting on the trades. Why do I say this? Well, all of these trades are being placed when price is either retracing or the market is moving strongly into one of these areas.
If you look closely at all the charts, you were shorting into a series of green candles (some of them very tall); psychologically, this doesn’t sit well with most non-professional traders. Only by knowing probabilities and accepting risk can a trader place these trades with self-assurance.
The other issue is patience. These setups don’t come every minute, or five minutes for that matter – more like two or three times a day (maybe). Indeed, this style of trading perhaps is not for everyone, but regardless of your method, identifying and executing low risk entries are the hallmark of a consistently profitable trader.
Until next time, I hope everyone has a great trading week.
Read the original article here - A Lesson on Finding Low Risk Trades
This content is intended to provide educational information only. This information should not be construed as individual or customized legal, tax, financial or investment services. As each individual's situation is unique, a qualified professional should be consulted before making legal, tax, financial and investment decisions. The educational information provided in this article does not comprise any course or a part of any course that may be used as an educational credit for any certification purpose and will not prepare any User to be accredited for any licenses in any industry and will not prepare any User to get a job. Reproduced by permission from OTAcademy.com click here for Terms of Use: https://www.otacademy.com/about/terms
Editors’ Picks

EUR/USD hovers around nine-day EMA above 1.1800
EUR/USD remains in the positive territory after registering modest gains in the previous session, trading around 1.1820 during the Asian hours on Monday. The 14-day Relative Strength Index momentum indicator at 54 is edging higher, signaling improving momentum. RSI near mid-50s keeps momentum balanced. A sustained push above 60 would firm bullish control.

GBP/USD holds medium-term bullish bias above 1.3600
The GBP/USD pair trades on a softer note around 1.3605 during the early European session on Monday. Growing expectation of the Bank of England’s interest-rate cut weighs on the Pound Sterling against the Greenback.

USD/JPY drops back below 157.00 on Japan's verbal intervention
USD/JPY has come under moderate selling pressure below 157.00 in the Asian session on Monday. The Japanese Yen lost ground to near 157.70 following Japan’s ruling Liberal Democratic Party's outright majority win in Sunday’s lower house election, opening the door to more fiscal stimulus by Prime Minister Sanae Takaichi. However, JPY buyers jumped back and dragged the pair southward on FX verbal intervention by Japan’s Finance Minister Katayama.
Editors’ Picks
EUR/USD hovers around nine-day EMA above 1.1800
EUR/USD remains in the positive territory after registering modest gains in the previous session, trading around 1.1820 during the Asian hours on Monday. The 14-day Relative Strength Index momentum indicator at 54 is edging higher, signaling improving momentum. RSI near mid-50s keeps momentum balanced. A sustained push above 60 would firm bullish control.

Gold sticks to gains above $5,000 as China's buying and Fed rate-cut bets drive demand
Gold surges past the $5,000 psychological mark during the Asian session on Monday in reaction to the weekend data, showing that the People's Bank of China extended its buying spree for a 15th month in January. Moreover, dovish US Federal Reserve expectations and concerns about the central bank's independence drag the US Dollar lower for the second straight day, providing an additional boost to the non-yielding yellow metal.
GBP/USD holds medium-term bullish bias above 1.3600
The GBP/USD pair trades on a softer note around 1.3605 during the early European session on Monday. Growing expectation of the Bank of England’s interest-rate cut weighs on the Pound Sterling against the Greenback.

Bitcoin, Ethereum and Ripple consolidate after massive sell-off
Bitcoin, Ethereum, and Ripple prices consolidated on Monday after correcting by nearly 9%, 8%, and 10% in the previous week, respectively. BTC is hovering around $70,000, while ETH and XRP are facing rejection at key levels.

Weekly column: Saturn-Neptune and the end of the Dollar’s 15-year bull cycle
Tariffs are not only inflationary for a nation but also risk undermining the trust and credibility that go hand in hand with the responsibility of being the leading nation in the free world and controlling the world’s reserve currency.
RECOMMENDED LESSONS
Making money in forex is easy if you know how the bankers trade!
I’m often mystified in my educational forex articles why so many traders struggle to make consistent money out of forex trading. The answer has more to do with what they don’t know than what they do know. After working in investment banks for 20 years many of which were as a Chief trader its second knowledge how to extract cash out of the market.
5 Forex News Events You Need To Know
In the fast moving world of currency markets where huge moves can seemingly come from nowhere, it is extremely important for new traders to learn about the various economic indicators and forex news events and releases that shape the markets. Indeed, quickly getting a handle on which data to look out for, what it means, and how to trade it can see new traders quickly become far more profitable and sets up the road to long term success.
Top 10 Chart Patterns Every Trader Should Know
Chart patterns are one of the most effective trading tools for a trader. They are pure price-action, and form on the basis of underlying buying and selling pressure. Chart patterns have a proven track-record, and traders use them to identify continuation or reversal signals, to open positions and identify price targets.
7 Ways to Avoid Forex Scams
The forex industry is recently seeing more and more scams. Here are 7 ways to avoid losing your money in such scams: Forex scams are becoming frequent. Michael Greenberg reports on luxurious expenses, including a submarine bought from the money taken from forex traders. Here’s another report of a forex fraud. So, how can we avoid falling in such forex scams?
What Are the 10 Fatal Mistakes Traders Make
Trading is exciting. Trading is hard. Trading is extremely hard. Some say that it takes more than 10,000 hours to master. Others believe that trading is the way to quick riches. They might be both wrong. What is important to know that no matter how experienced you are, mistakes will be part of the trading process.
The challenge: Timing the market and trader psychology
Successful trading often comes down to timing – entering and exiting trades at the right moments. Yet timing the market is notoriously difficult, largely because human psychology can derail even the best plans. Two powerful emotions in particular – fear and greed – tend to drive trading decisions off course.