3 Ways to Trade with Elliott Waves Theory

Ralph Elliott developed the theory that bears his name based on the moves the stock market made. His strong belief was that the market is the sum of human behavior. As such, to this day, the Elliott Waves Theory is one of the best trading theories to predict financial markets’ behavior.
Forex trading is more about managing risk than being right. Any trading system should have a sound money management plan. Moreover, executing the money management plan is what makes the trading system perform.Elliott Waves Theory
The Elliott Waves Theory allows for great risk reward ratios. Not only traders know where price will go, but they can incorporate the time element too.
Price and time represent the two pillars of the holy grail in trading. Knowing where the price goes and when makes a difference between good and excellent trades.
Here’s a quick guide on how to trade with Elliott Waves Theory. Furthermore, the setups explained here have entries, stops and take profit levels based on realistic risk-reward ratios.
In this business, anything between 1:2 or 1:3 represents a realistic approach. It means that for every pip risked, traders look for a double or triple reward.
Basics of Elliott Waves Theory
Elliott found that the market moves in two distinct ways. As such, he started to look at waves as defining impulsive or corrective activity. To be more exact, the market can either form an impulsive or a corrective wave.
An impulsive wave is a five-wave structure. As a rule of thumb, any impulsive wave is labeled with numbers: 1-2-3-4-5
Elliott Waves TheoryOn the other hand, with letters, Elliott showed corrective activity. He referred to corrective waves as three-wave structures. While this is true most of the times, not every corrective pattern literally has a three-wave structure.
The idea behind impulsive and corrective waves was that together, the two make a cycle. It was Elliott’s strong belief that the market moves in cycles of different degrees.
As such, one cycle has an impulsive and a corrective wave. Or, as Elliott put it, five waves up corrected with three waves down, in a bullish trend, and five waves down corrected with three waves up in a bearish one.
The cycles of different degrees appear everywhere. For example, in a five-wave structure, labeled 1-2-3-4-5, the 2nd, and the 4th waves show corrections, while the 1st, 3rd and 5th show impulsive moves.
However, the 1st wave of the above impulsive activity must have another five-wave structure of a lower degree. And the 3rd and the 5th waves too.
This is what makes the Elliott Waves Theory a complicated method to trade if the basic idea is not properly understood from the start.
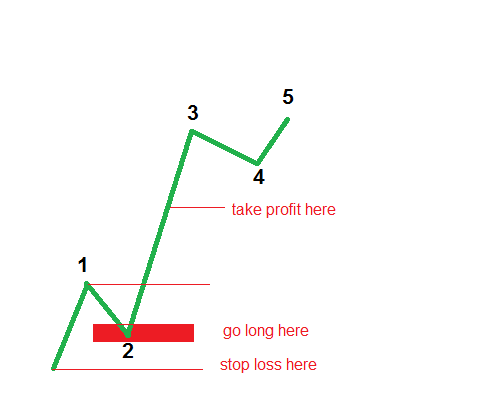
Trading the Third Wave
extended wave must be bigger than 161.8% of the other non-extended waves.
Elliott Waves TheoryIn plain English, it is the longest wave. Typically, the third wave extends.
When this happens, the previous wave (the 2nd one) retraces between 50% and 61.8% of the 1st one. Third wave extensions happen most of the time.
This gives a perfect trade. In a bullish impulsive wave, simply place a pending buy limit order between 50% and 61.8% of the 1st wave. The take profit is 161.8% projected from the end of the 2nd wave, while the stop loss must be where the impulsive activity starts.
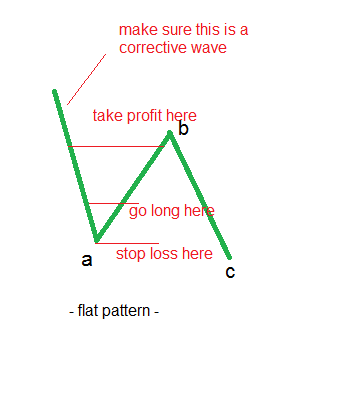
Trading a Flat Pattern
Among corrective waves, flat patterns form all the time. Elliott identified no less than ten such patterns.
Elliott Waves TheoryWhile this is a big number, all types have one thing in common: the b-wave must retrace minimum 61.8% of the previous a-wave. This is more than enough for a trade.
Therefore, the key stays with interpreting the a-wave. Is it impulsive or corrective? A flat pattern has an a-b-c structure. Moreover, waves a and b represent corrective activity, and only the c-wave shows a five-wave structure.
If the a-wave doesn’t look impulsive, it can only be corrective. As such, 61.8% retracement must follow.
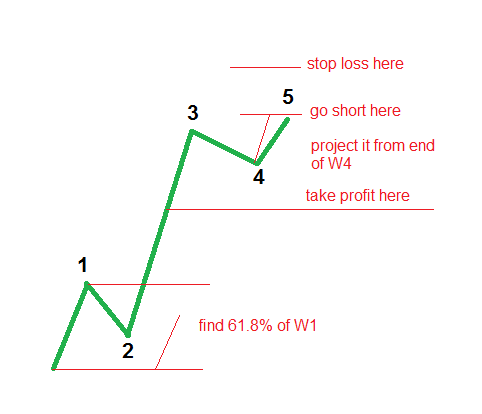
Trading the Fifth Wave
One of the most powerful rules in the theory is that the first wave should NOT equal the fifth. This gives traders an educated guess because they already know the 1st wave’s length.
Therefore, Elliott traders simply measure the length of the 1st wave and project the outcome from the 4th wave’s end. The 5th should be different.
However, not every length works. Look for the 5th wave to be 61.8% of the 1st wave. When this happens, simply go short in a bullish five-wave structure, targeting 38.2% retracement of the whole impulsive move.
Conclusion
These three possibilities to trade with Elliott Elliott Waves TheoryWaves Theory only show a few possible trading setups. The truth is that this wonderful theory allows to position for every single move the market makes.
Therefore, you will end up forecasting price on the right side of the screen based on what’s on the left. Real Elliott traders never count actual prices.
The correct approach is to let the market confirm the previous pattern first. After all, the Elliott Waves Theory basis its rules on a pattern recognition approach.
Traders make top-down analysis starting with the monthly or bigger time frames. After that, they come down all the way until the daily or lower time frames to pick a trade.
If the count on the bigger time frames makes sense and respects the Elliott rules, the theory reveals future market moves because of human behavior. Never have greed and fear been better represented in a trading theory, like in Elliott Waves Theory.
Moreover, place the stop loss where the extension gets invalidated, and nice risk-reward ratio results. Trading the 5th wave, though, is riskier, as there are multiple possibilities the market may form here.
Author

Colibri Trader
Colibri Trader
Colibri Trader, as he is known in the circles, is based in London, UK. He Started his career in one of the leading prop trading houses at the time and then has moved out to form his own company- Colibri Trader Limited.


