3 Important Technical Indicators and How to Use Them

Trend traders follow the simple process of isolating trends and then making profits from them.
There are various ways of doing this and trend traders have their own personal favorites.
As a rule, no single indicator will have the distinction of being a billionaire-maker because trading success also relies on risk management and trading psychology, among other things. But there are some indicators that proved to be very reliable so much so that many trend traders use them repeatedly.
Indicators are images that analysts superimpose on the stock market chart and these images appear through mathematical computations on price and volume. Traders use these indicators to make a calculated prediction of where the price of the stock will most likely swing to.
Types Of Indicators
Most indicators appear to be exactly the same but knowledgeable traders can see the slight variations among them.
An indicator can show a picture from the price movements while another may show the dollar movement (PPO and MACD).
Another interesting thing is that because indicators may use the same type of data, you can cluster them to belong to the same “family”. A good example of a family would be the MACD, stochastics, and RSI (which we would discuss later).
Since the variations are very slight, using just one indicator could be enough. Using all three for the same time period of the same stock isn’t going to give you an extra advantage because you will get the same information from each of them.
The 4 major types of indicators are:
Trend Indicators
These indicators are useful in knowing which direction the market is moving in and if there is indeed a trend that is developing.
Experts sometimes refer to them as oscillators because the movement flows from high to low values like a wave.
We will discuss trend indicators and touch on the subjects of Parabolic SAR, parts of the Ichimoku Kinko Hyo, and Moving Average Convergence Divergence (MACD).
Momentum Indicators
Momentum indicators can tell you how strong a trend is and they can give you a sign if a reversal is about to happen soon. You can use them to pick out price highs and lows.
Momentum indicators consist of Relative Strength Index (RSI), Stochastic, Average Directional Index (ADX), and Ichimoku Kinko Hyo.
Volume Indicators
They tell you how much volume is changing over time, how many stocks traders are selling and buying at a certain time.
Obviously, they indicate the volume of trades behind a particular price movement which tells traders a lot of things.
They can be very useful because a price movement with a high volume is a very strong signal while a price movement with a low volume isn’t so good.
Volatility Indicators
Simply put, they can tell you how much the price is changing in a given period. For traders, volatility helps them forecast what is going to happen to the price of a certain security.
So, without it, it would be difficult to make a profit. The stock price has to change for a trader to buy or sell in his favor.
Higher volatility just means that the price of a stock is changing very fast.
It does not really show where it’s going, but it gives you an idea of the range of the prices.
1. The Stochastic Oscillator
The Stochastic Oscillator is a momentum indicator that compares the closing price of a security in relation to its range of prices over a certain period.
It is highly technical but it’s one of the most reliable momentum tools that a trader can use.
It measures current momentum by comparing the highs and lows of a historical set of prices in the form of resistance and support levels.
The main premise behind this tool is that prices usually close near their high during an upward-trending market and normally close near their low during a downward-trending market.
This indicator shows the closing prices in relation to the high-low range over a selected period of time. The default period of the Stochastic indicator is 14 periods.
The formula for this is:
%D = 3-day SMA of %K
Traders use this indicator to mark overbought and oversold situations that could pave the way for a price reversal.
Readings that go over the 80-level signify that prices are overbought and that they could soon head downward (as the red rectangles show).
Conversely, the oversold threshold is under 30 – which means that the prices might be moving upward (as the green rectangles denote).
When the %K (blue line) crosses the %D line (orange line), you can see some trading signals. Anytime the blue line goes under the orange line, it means a bearish signal.
It’s stronger if the indicator is straying off the overbought situation. On the opposite end, when the blue line goes over the orange line, it is a bullish signal.
When you see the closing levels consistently gravitating close to the top of the range, it shows accumulation. There is buying pressure in this case.
When the closing levels are near the bottom of the range, it points out distribution or selling pressure.
2. Support and Resistance
You can find support on the chart by looking for a zone or an area where the price of an asset has difficulty moving below or a line/area where the asset price has recoiled on in the recent past.
You can say that support is a key area on the chart where buyers are more open to buying an asset and sellers are more inclined to get out of their positions on the asset.
Support happens when selling interest ebbs down and buying interest rises so that the prices will take a breather from their initial downward trajectory.
On the hand, you can find resistance in a zone or area where the price of an asset has difficulty moving above or a line/area where the asset prices have retreated in the recent past.
You can also say that resistance is a key area on the chart where traders are more likely to give up their long positions and embrace a short position.
When buying interest tapers and the sellers dominate the market, prices will relax from the uptrend and leave the price high to give way to resistance.
Here are three ways to define support and resistance:
- Use psychology points to determine support and resistance areas.
- Use indicators such as pivot points and Fibonacci level to determine support and resistance areas
- Use other price action tools to determine support and resistance. They could be chart patterns or candlestick patterns.
Use Pivot Points To Determine Support and Resistance
Let’s focus on the second one - Determine support and resistance areas using pivot points.
Traders also use indicators as a basis to look for support and resistance. The two very popular and reliable indicators that traders often use are the pivot point indicators and the Fibonacci retracement too.
The pivot points are very useful for this process especially custom indicators that can help you trace the daily, weekly, or monthly pivot support/resistance points on the charts.
Normally, when you make use of the pivot points, you calculate using the price data of the high, low, and closing prices from the previous day’s trading results.
Using these data, you can see that we have derived seven daily pivot points:
One central pivot (refer to the chart below, shown in purple), three support pivots (shown in green) and another three resistance pivots (shown in red).
Just remember that the pivots do not behave as we have strictly described them.
Another important thing to note is that a resistance pivot may function as a support and a support pivot may serve as a resistance depending on the price action. In both situations, you can find it after a breakout and an attempted pullback of price action to the broken pivots.
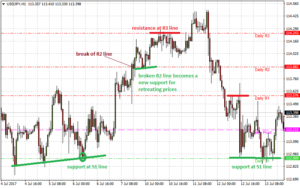
The chart above shows you the pivot points using a pivot point calculator to plot the points.
3. Moving Average Convergence Divergence (MACD)
The next item we will discuss is the Moving Average Convergence Divergence (MACD). It’s another trend indicator but it uses a fast line, slow line, and a histogram.
Basically, the MACD histogram will tell you which one between the bulls or the bears is stronger.
Additionally, you can see from this indicator if the current market atmosphere is getting better or worse. Trend analysts consider the MACD both as a trend following indicator and an oscillator since it also shows momentum.
This is why many stock traders turn to it and pick it as one of the best technical indicators.
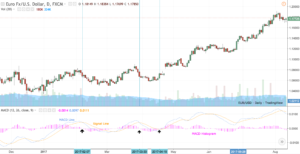
You can see the indicator at the bottom of the chart when you refer to the image below.
Its name originates from the fact that it presents 2 moving averages and shows when they are converging or diverging.
When you want to develop a trading strategy using the MACD indicator, you need to use buying and selling signals, and take into account the potential price increase or decrease as you observe them on the chart.
MACD - How It Works
Gerald Appel developed this indicator to emphasize when momentum and prices are going up in tandem, and also when momentum and prices are moving at their own distinct paces.
Let’s take a closer look at it.
As you may have noticed, you can use the indicator to measure momentum by comparing two moving averages.
If you look at the chart above, you will see there are three elements that make up the MACD.
There is a blue line which represents the MACD Line and an orange line which we refer to as the Signal Line. The purple bars denote the MACD histogram or the distribution of numerical data.
If you use this indicator on your trading platform, the template values are 12, 26, and 9 but you can change them as they fit your trading style.
Majority of traders use crossover buying and selling signals when utilizing the MACD. This occurs when two line cross. The point where they cross is the moment where the momentum gains speed.
Bullish and Bearish MACD Crossover
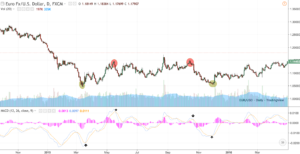
There are two general types of crossovers – the bullish and the bearish.
A bearish MACD Crossover happens when the MACD line crosses under the Signal Line (take a look at the red circles above).
This indicates that the price in the underlying asset will probably decrease. Remember that it’s quite knotty to learn to trade using indicators.
For the newbies who want to get their feet wet on trading, the first crucial thing to know is that you need a brokerage account to be able to get access to the stock market.
Final Words
Although there are many techniques and indicators that you can use, these are the five most common and reliable technical indicators that you should familiarize yourself with.
However, it’s only by using them correctly that you can get the maximum benefits from them.
Just because these indicators are reliable doesn’t mean that they will provide you with the exact signals all the time.
Technical indicators are merely tools. As such, you should incorporate them within a trading system that gives consistent signals so you can execute them for a higher risk/reward ratios.
You can supplement your learning through trading books, trading eCourses, and online education resources from reputable and veteran traders.
Author

Baruch Silvermann
The Smart Investor
Baruch Silvermann is a personal finance expert, investor for more than 15 years, digital marketer and founder of The Smart Investor.


