Zilliqa price primed for a 40% breakout as key indicator screams buy
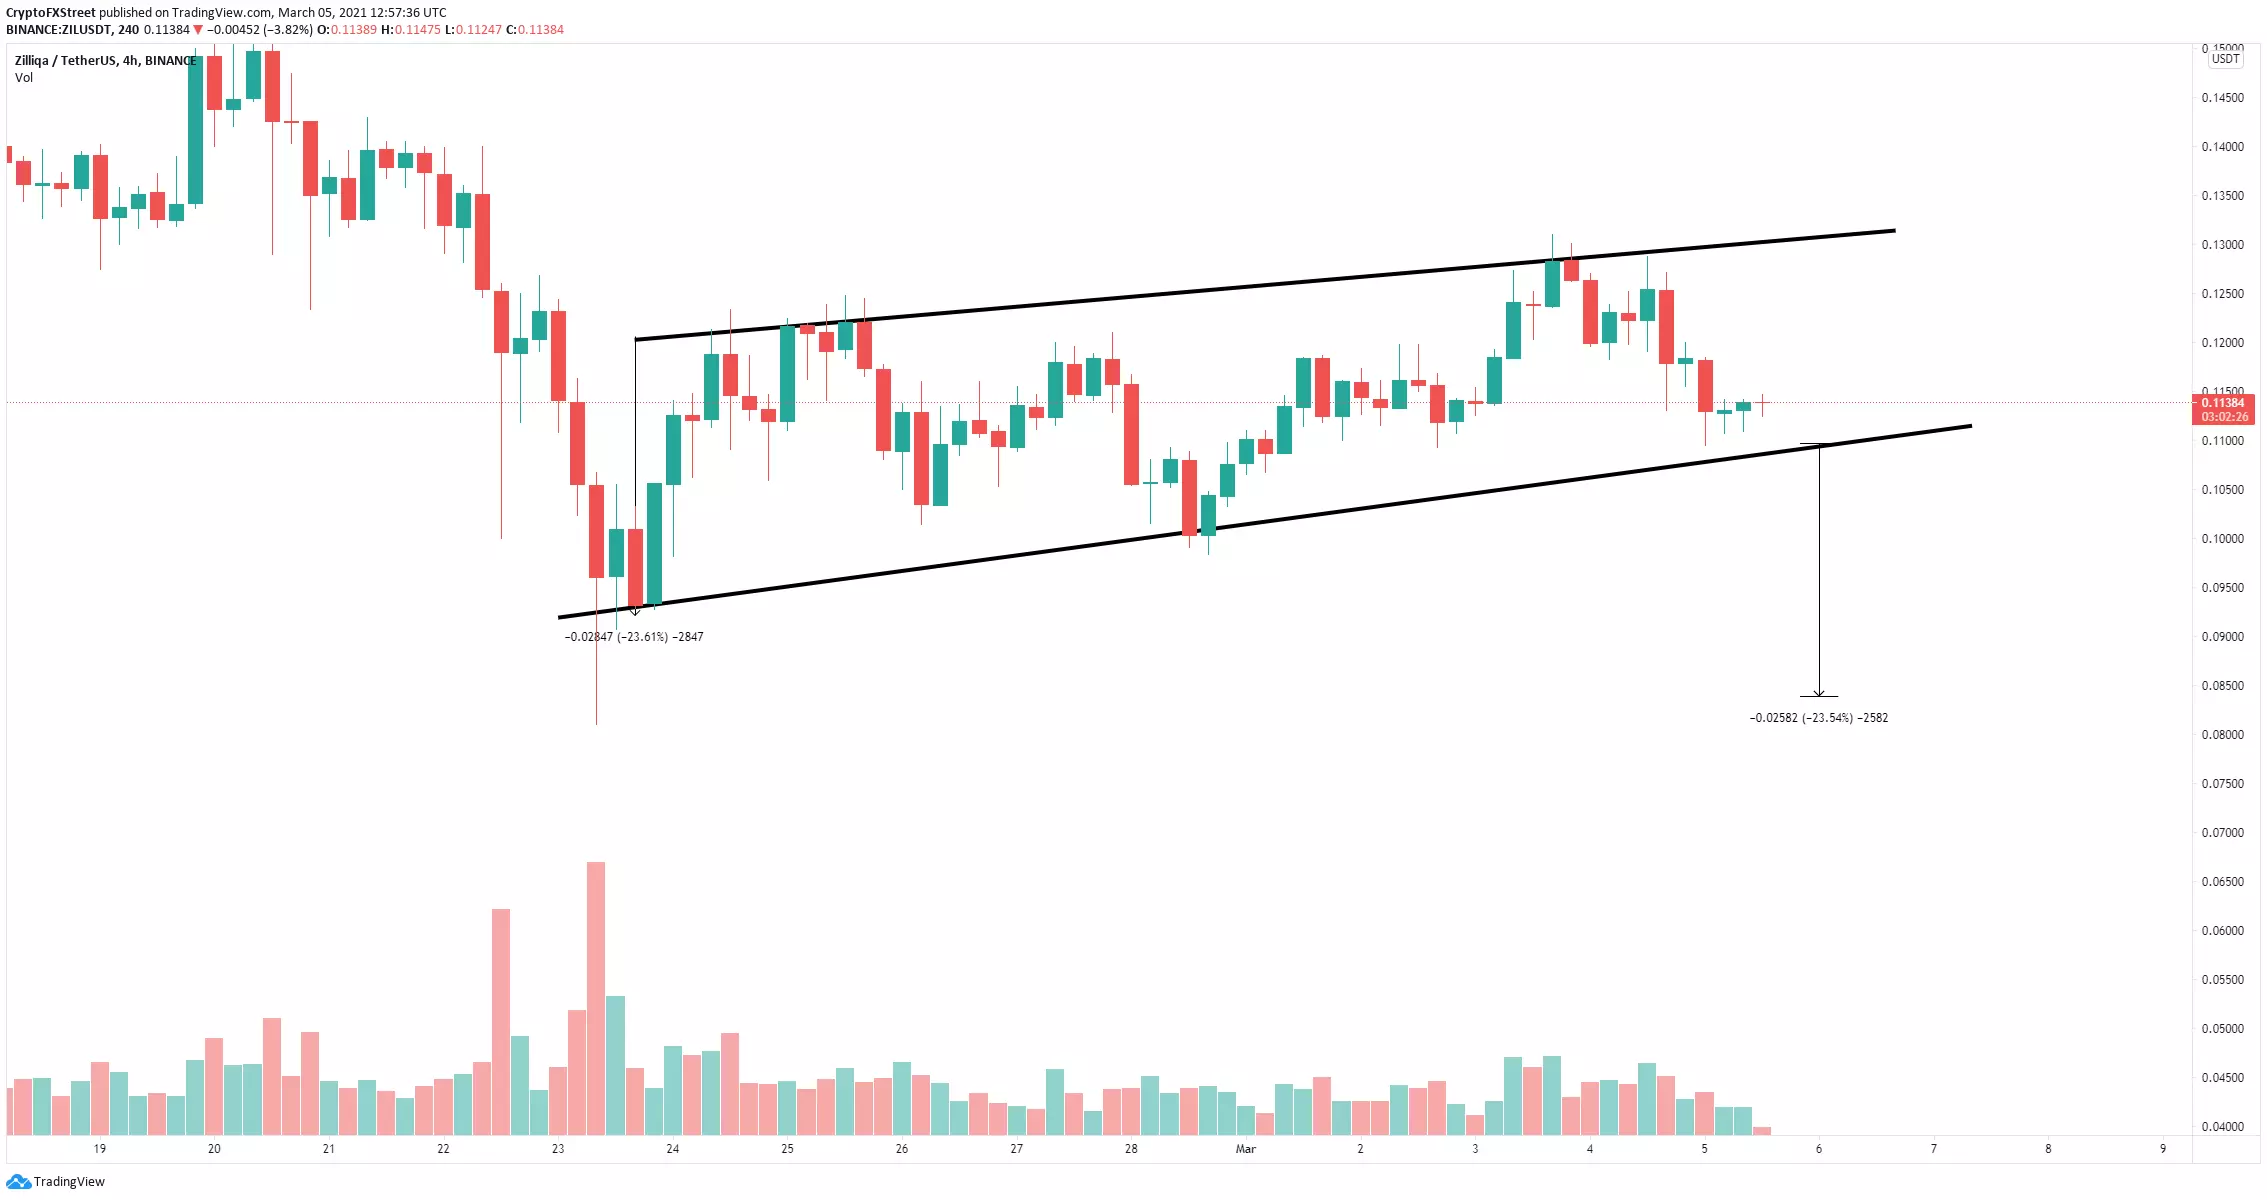
- Zilliqa price is contained inside an ascending wedge pattern on the 4-hour chart.
- The digital asset seems primed for a massive 40% breakout.
- A key indicator has presented a buy signal which should help Zilliqa.

Zilliqa has been trading inside a slow uptrend on the 4-hour chart maintaining higher lows. The digital asset is ready for a new leg up towards its previous 2021-high.
Zilliqa price on a journey towards $0.162
On the 4-hour chart, the TD Sequential indicator has just presented a buy signal at the bottom of the ascending wedge pattern. A rebound from this critical support level should swiftly drive Zilliqa price towards the upper trendline at $0.131.
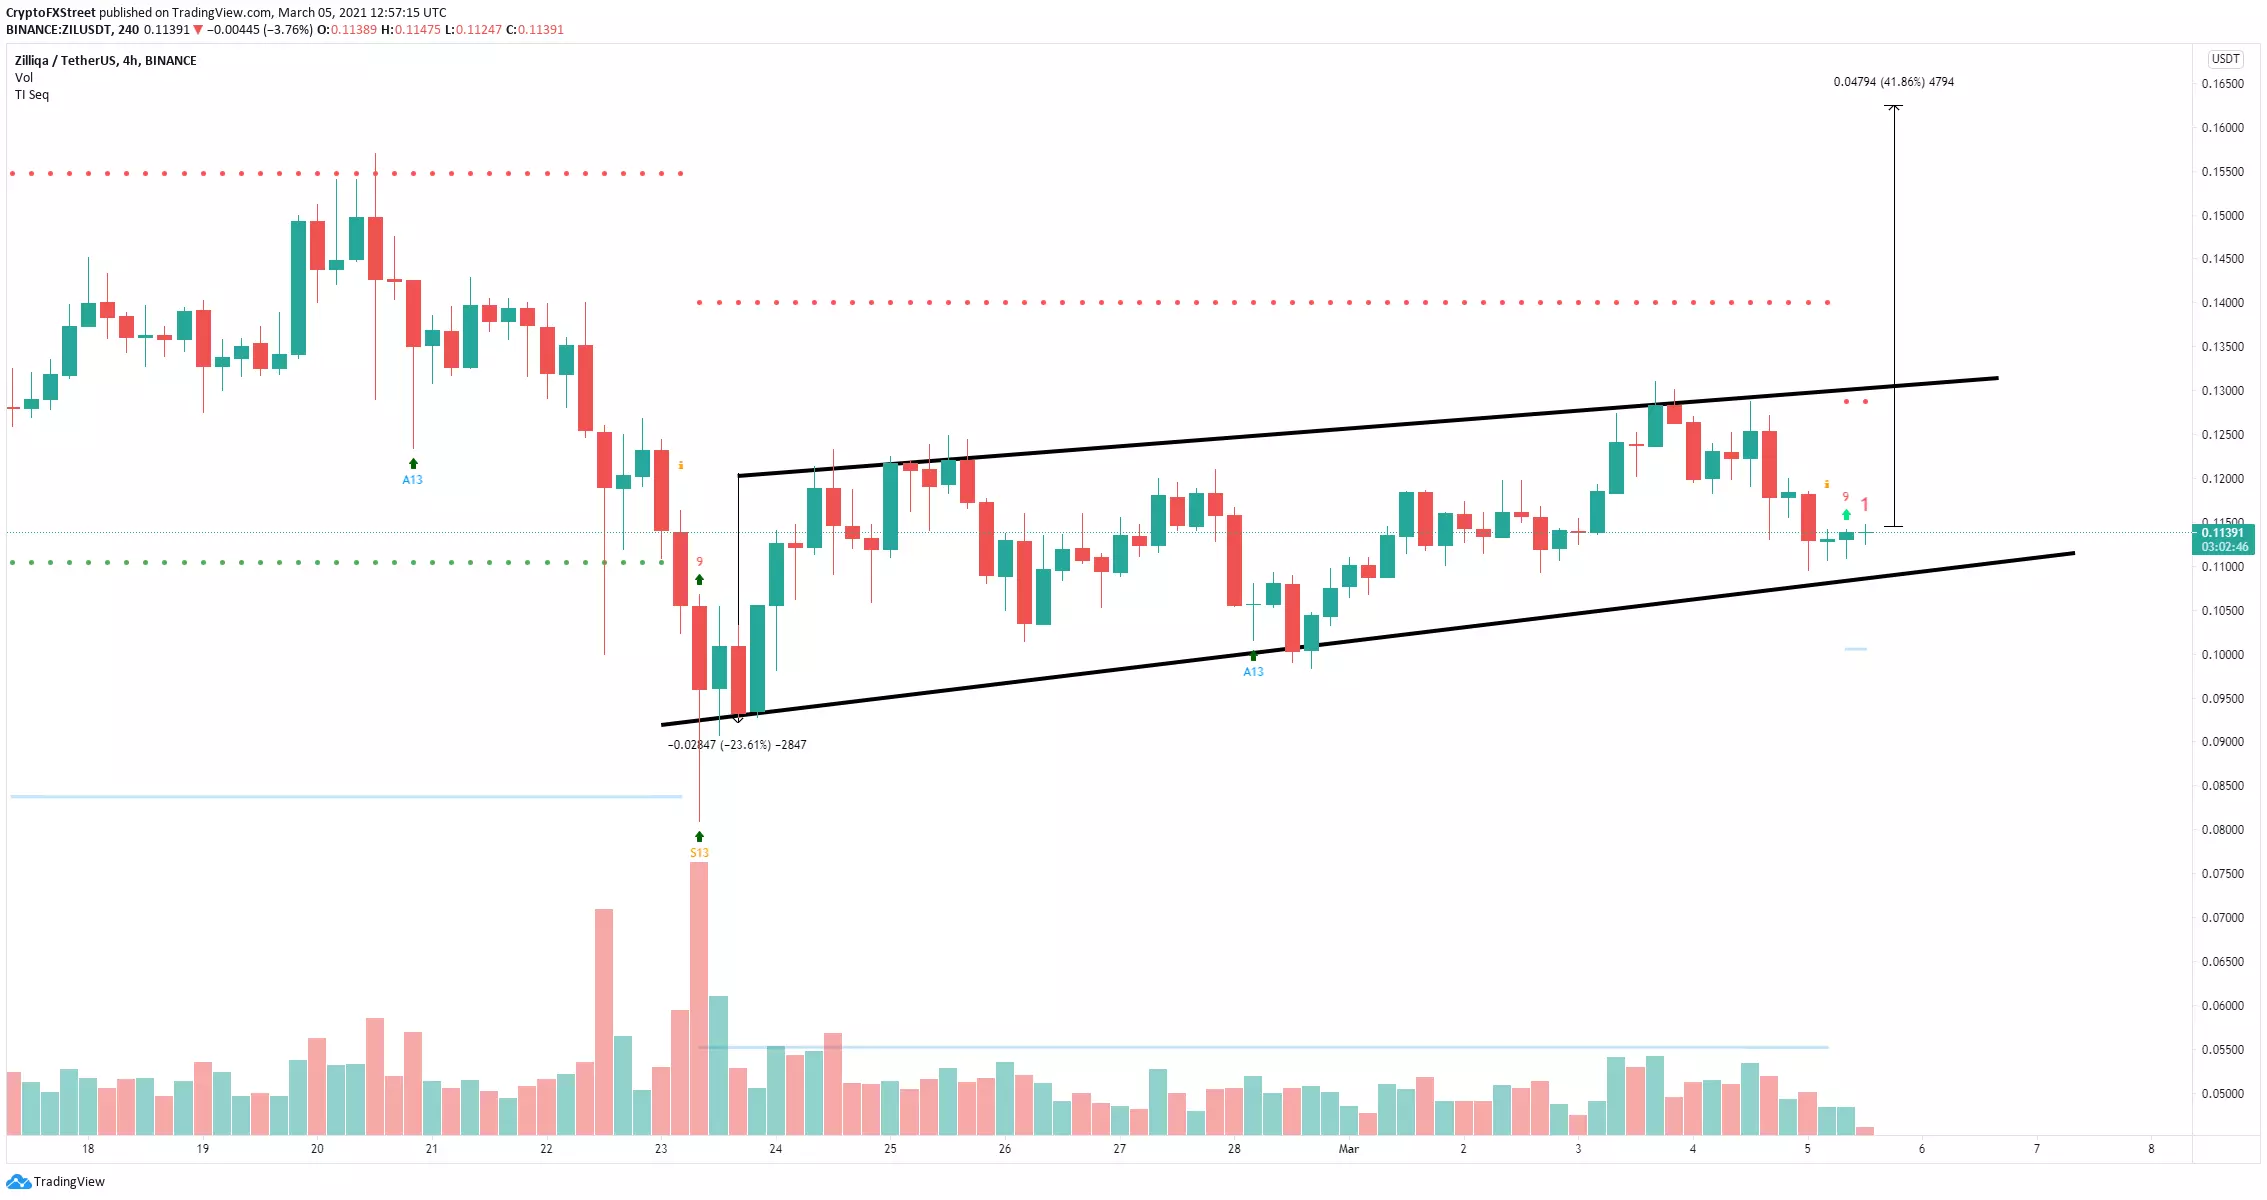
ZIL/USD 4-hour chart
Bulls have a lot of momentum and aim for a breakout above the key resistance trendline at $0.131. Climbing above this point will push Zilliqa price towards $0.162 in the long-term a new 2021-high.
ZIL/USD 4-hour chart
On the other hand, the bears need to see a candlestick close below $0.11 to invalidate the buy signal. A breakdown below the lower trendline at $0.109 will push Zilliqa price down to $0.084.
Author

Lorenzo Stroe
Independent Analyst
Lorenzo is an experienced Technical Analyst and Content Writer who has been working in the cryptocurrency industry since 2012. He also has a passion for trading.


