Zilliqa price is setting up for a 20% rally back to $0.11
- ZIL price retests the 50-day moving average for the first time since the 300% bull run began.
- Zilliqa price is back above a parallel channel median line.
- Invalidation of the bullish trade setup is a drop to $0.075.

Zilliqa price presents a high-risk trade setup
Zilliqa price shows hopeful signs for scalpers looking to catch a short-term trade. The current C leg has three sets of impulses within the move, which could be early evidence of its termination. Additionally, the ZIL price hit a low at $0.09235 but settled above the 50-day moving average. A 20% price spike into $0.1125 could occur, as this is the first time the price becomes acquainted with the moving average at these levels.
Zilliqa price currently trades at $0.09413 and is likely to experience choppy price action in this area before making a run back up. A dollar-cost average approach could be a great strategy for approaching this trade setup, as a new low around $0.084 is still possible. It is worth noting that the volume profile shows a tapering pattern adding more confluence that the downtrend will end soon.
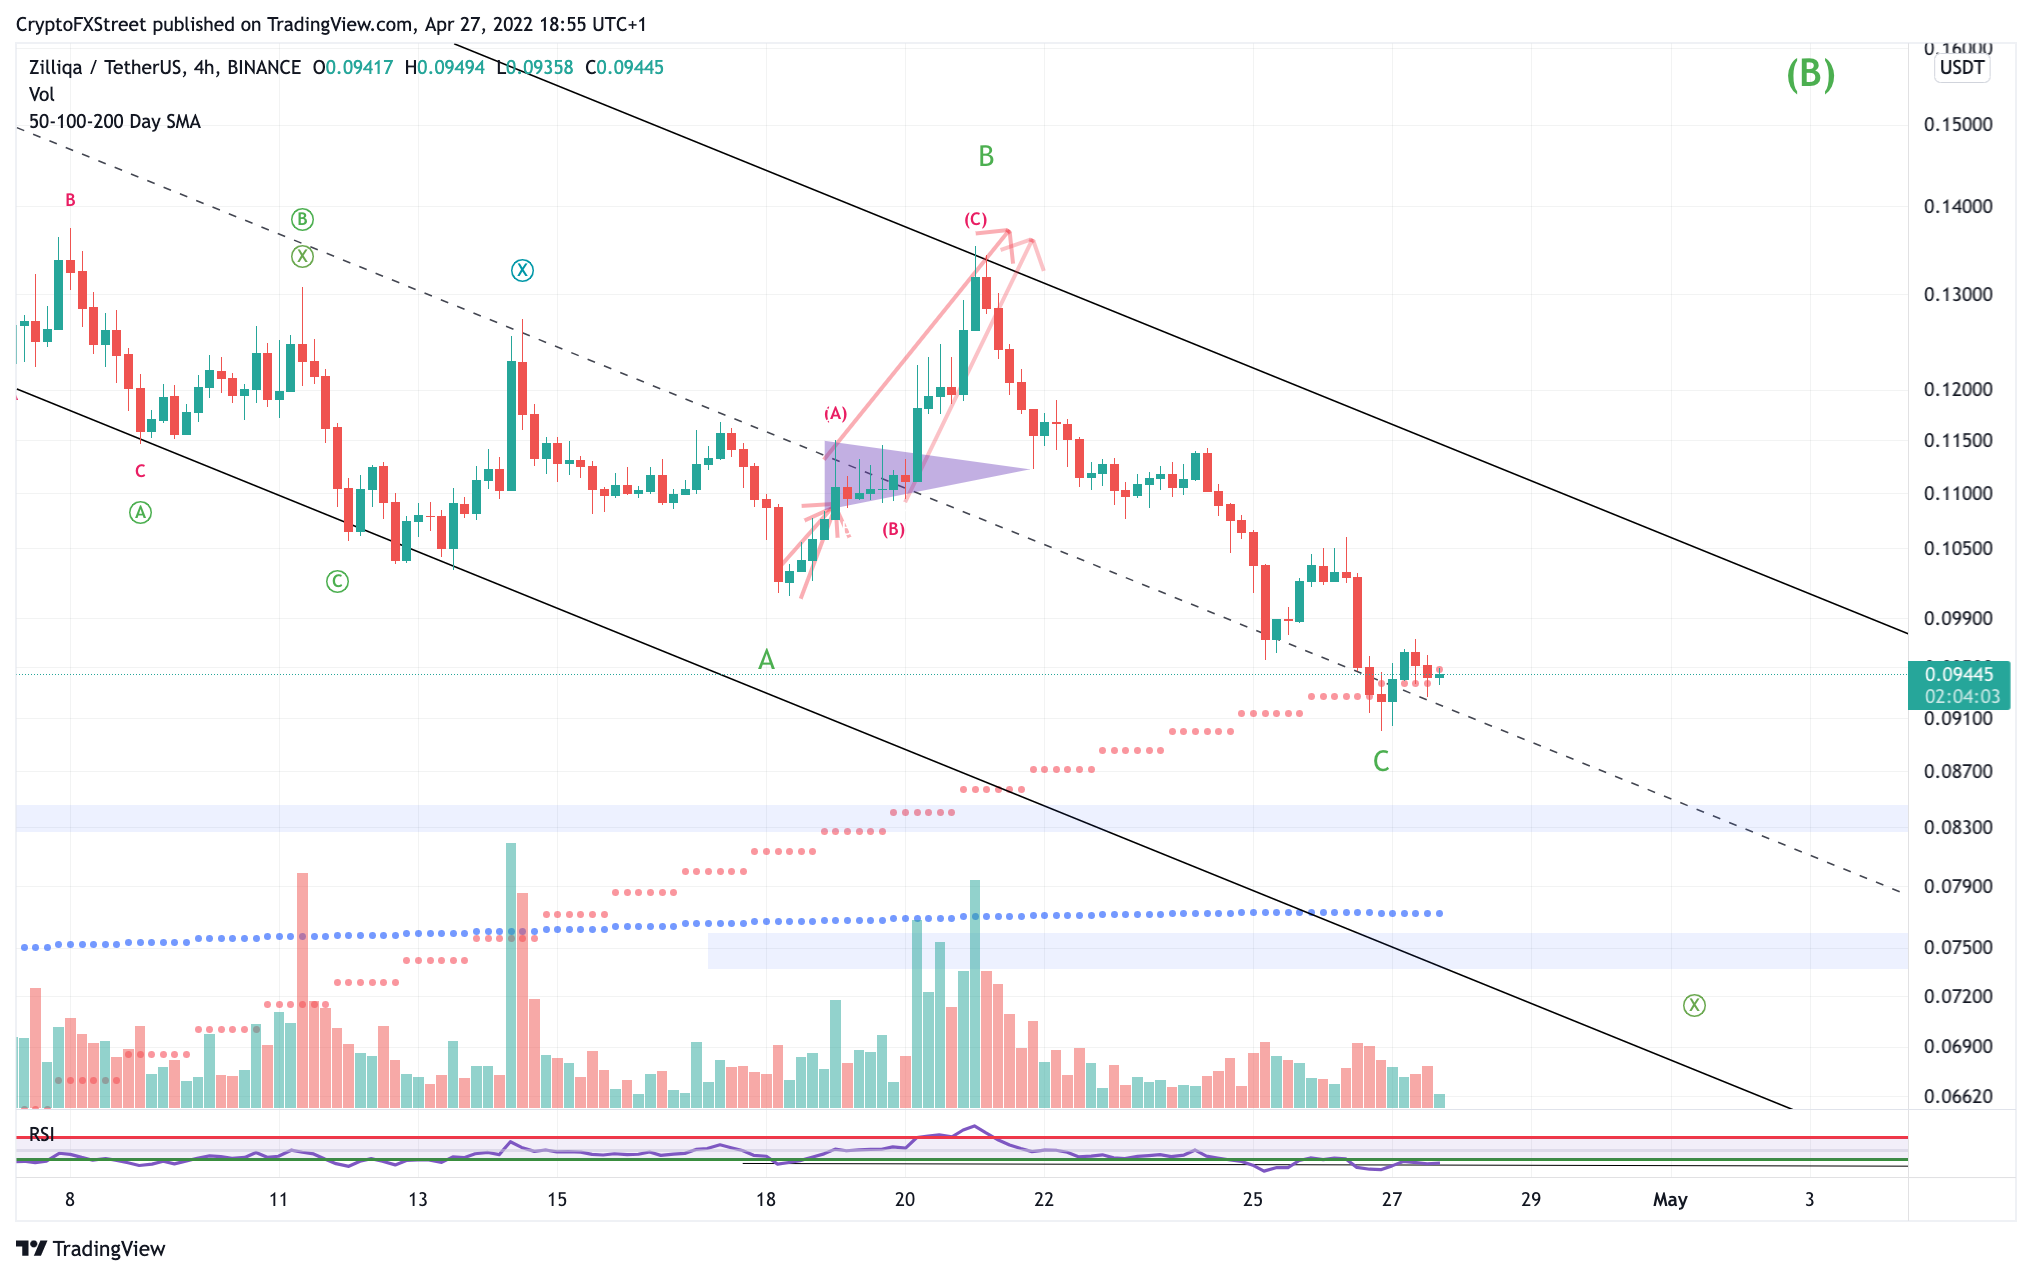
ZIL/USD 4-Hour Chart
Invalidation of the bullish trade setup is a drop below $0.075, creating a 1-1 trade setup with a profit target at $0.1125. IfF, the bears, can tap this level, the uptrend scalp idea will be void. The bears could continue the downtrend towards $0.065, resulting in a 30% dip from the current Zilliqa price.
Author

Tony M.
FXStreet Contributor
Tony Montpeirous began investing in cryptocurrencies in 2017. His trading style incorporates Elliot Wave, Auction Market Theory, Fibonacci and price action as the cornerstone of his technical analysis.


