Toncoin Price Forecast: TON correction deepens as bears target $1.12
- Toncoin price extends its correction on Wednesday after falling over 4% in the previous two days.
- On-chain and derivatives data support bearish sentiment with falling trading volume and negative funding rates.
- The technical outlook points to the broader downtrend intact, with bears targeting levels below $1.12.

Toncoin (TON) price continues to trade in red, slipping below $1.29 at the time of writing on Wednesday, after falling over 4% so far this week. Weakening on-chain activity and derivatives data show fading participation, supporting the bearish outlook. On the technical side, TON continues to trade within a broader downtrend, keeping the risk in focus.
Toncoin’s fading investor participation
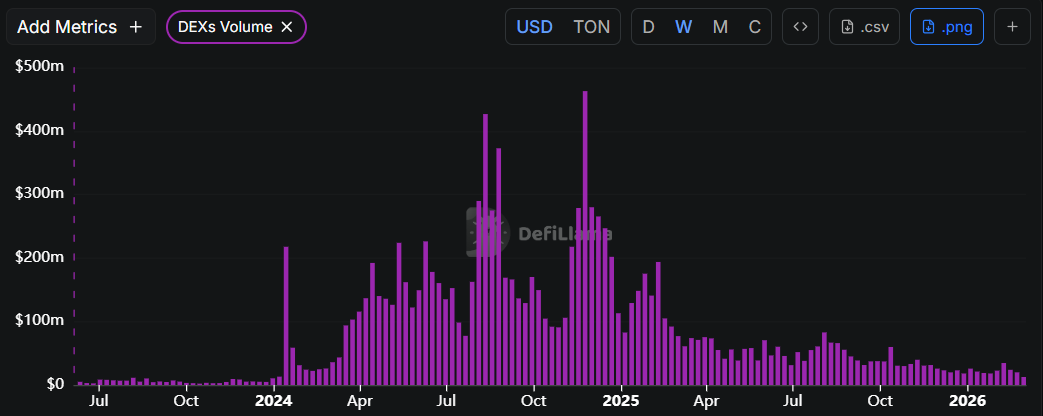
DefliLlama data indicates that the Toncoin Decentralized Exchanges (DEXs) weekly trading volume has declined to $12.6 million so far this week, the lowest levels since early January 2024. This volume drop indicates a fall in traders’ interest and liquidity in Toncoin, boosting its bearish outlook.
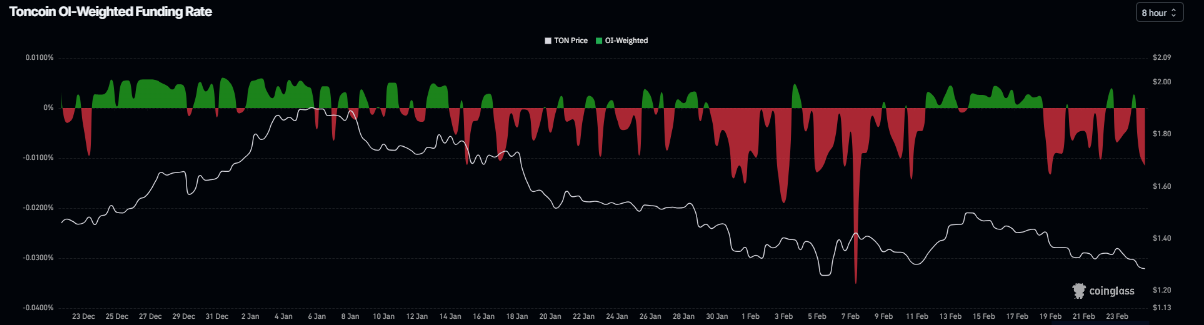
On the derivatives side, TON’s negative funding rates further project bearish sentiment. The metric turns negative on Tuesday and stands at -0.011% on Wednesday, nearing levels seen on February 19, when TON prices dropped sharply. The negative ratio suggests that shorts are paying longs, suggesting bearish sentiment toward Toncoin.
Toncoin Price Forecast: TON extends correction as bears eye break below $1.12
Toncoin price is trading at $1.28 as of writing on Wednesday. The near-term bias is mildly bearish, as price holds below the 50-day and 100-day Exponential Moving Averages (EMAs), keeping the broader downtrend intact after the recent break under the descending trendline resistance at $1.40.
On the daily chart, the Relative Strength Index (RSI) around 36 stays below the 50 line, indicating prevailing selling pressure rather than trend exhaustion. The Moving Average Convergence Divergence (MACD) indicator has slipped back into negative territory with the MACD line below the signal line and a mildly negative histogram, reinforcing weakening momentum after an earlier recovery attempt faded beneath the cited resistance area.
Immediate resistance is near $1.40, where the broken trendline cap coincides with the recent failure zone, and a stronger barrier lies at the horizontal level of $1.47, guarding the path toward the 50-day EMA cluster.
On the downside, initial support emerges at the recent trough around $1.26, and a clear break below this area would open the way toward the $1.12 region, where sellers could again test the durability of the broader base.
As long as TON trades below $1.40, rallies are expected to meet supply, and the downside bias will remain favored in the short term.
(The technical analysis of this story was written with the help of an AI tool.)
Author

Manish Chhetri
FXStreet
Manish Chhetri is a crypto specialist with over four years of experience in the cryptocurrency industry.