XRP Elliott Wave technical analysis [Video]
![XRP Elliott Wave technical analysis [Video]](https://editorial.fxstreet.com/images/Markets/Currencies/Cryptocurrencies/Coins/Ripple/Ripple_Watch_XtraLarge.jpg)
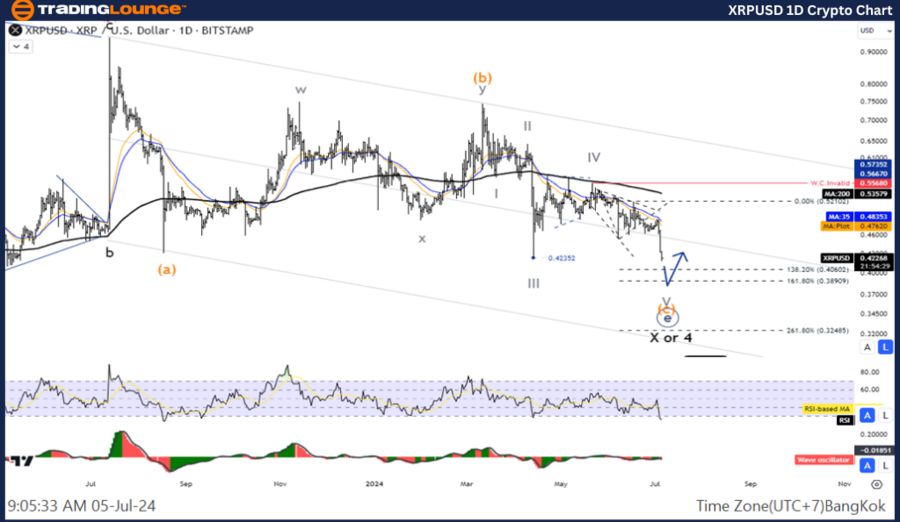
Elliott Wave Analysis TradingLounge Daily Chart.
XRP/USD Elliott Wave technical analysis
Function: Counter Trend
Mode: Corrective
Structure: Flat
Position: Wave C
Direction next higher degrees: Wave (II) of Impulse
Details: Wave II Is equal to 61.8% of Wave I at 5.225
Ripple/ U.S. dollar(XRPUSD)Trading Strategy: Decreasing wave ((E)), which is the last wave in the Triangle pattern before prices re-enter the uptrend. So wait for the correction to complete to join the trend again.
Ripple/ U.S. dollar(XRPUSD)Technical Indicators: The price is below the MA200 indicating a downtrend, The Wave Oscillator is a Bearish Momentum.
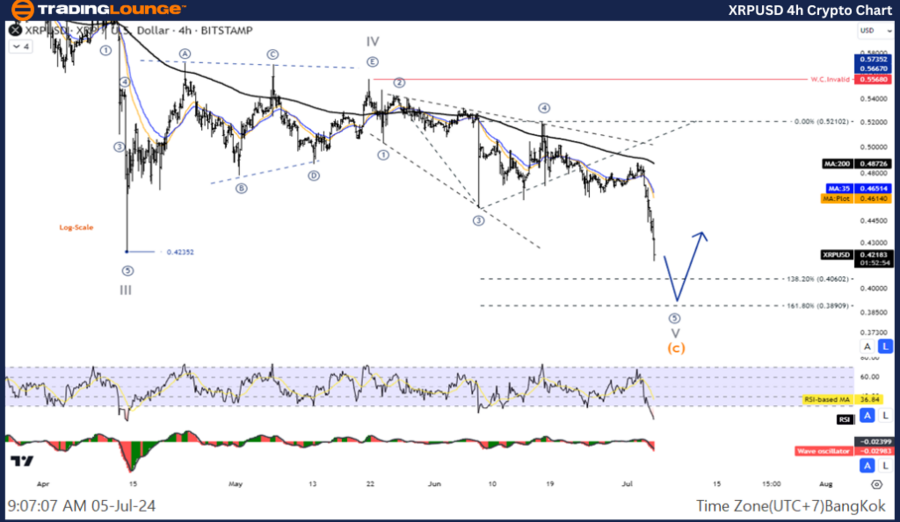
XRP/USD Elliott Wave four-hour chart
Function: Counter Trend
Mode: Corrective
Structure: Triangle
Position: Wave E
Direction next higher degrees: Wave 4 of Impulse
Wave cancel invalid level: 0.486
Details: Movement within the triangle pattern before the price Declines again. in Wave 5
Ripple/ U.S. dollar (XRPUSD) Trading Strategy: Decreasing wave ((E)), which is the last wave in the Triangle pattern before prices re-enter the uptrend. So wait for the correction to complete to join the trend again.
Ripple/ U.S. dollar(XRPUSD)Technical Indicators: The price is below the MA200 indicating a downtrend, The Wave Oscillator is a Bearish Momentum.
XRP Elliott Wave technical analysis [Video]
Author

Peter Mathers
TradingLounge
Peter Mathers started actively trading in 1982. He began his career at Hoei and Shoin, a Japanese futures trading company.


