XLM Price Prediction: Stellar awaits a 60% bull rally from a bullish pennant pattern
- XLM price is consolidating in a bullish pennant pattern, suggesting a massive 60% run-up soon.
- A decisive 6-hour candlestick close above $0.51 is necessary to break out from the bullish pennant.
- A bearish breakdown from the pennant could result in a downswing to the hourly 100 SMA at $0.41.

XLM price saw a 160% upswing between late January and mid-February to hit a new all-time high at $0.60. However, since hitting the record level, Stellar has slipped into a consolidation phase.
Depending on its close relative to a bullish pennant pattern drawn in the six-hour chart, XLM could either surge massively or drop to an immediate support barrier.
XLM price prepares for a higher high
XLM price shows a bullish bias due to the formation of a bullish pennant pattern. The 160% surge between January 28 and February 13 formed the “flag pole,” while the consolidation since then resulted in the “pennant.”
This continuation pattern forecasts a 60% upswing to $0.82, determined by measuring the flag pole’s length and adding to the breakout at $0.51.
Therefore, a six-hour candlestick close above $0.51 is imperative.
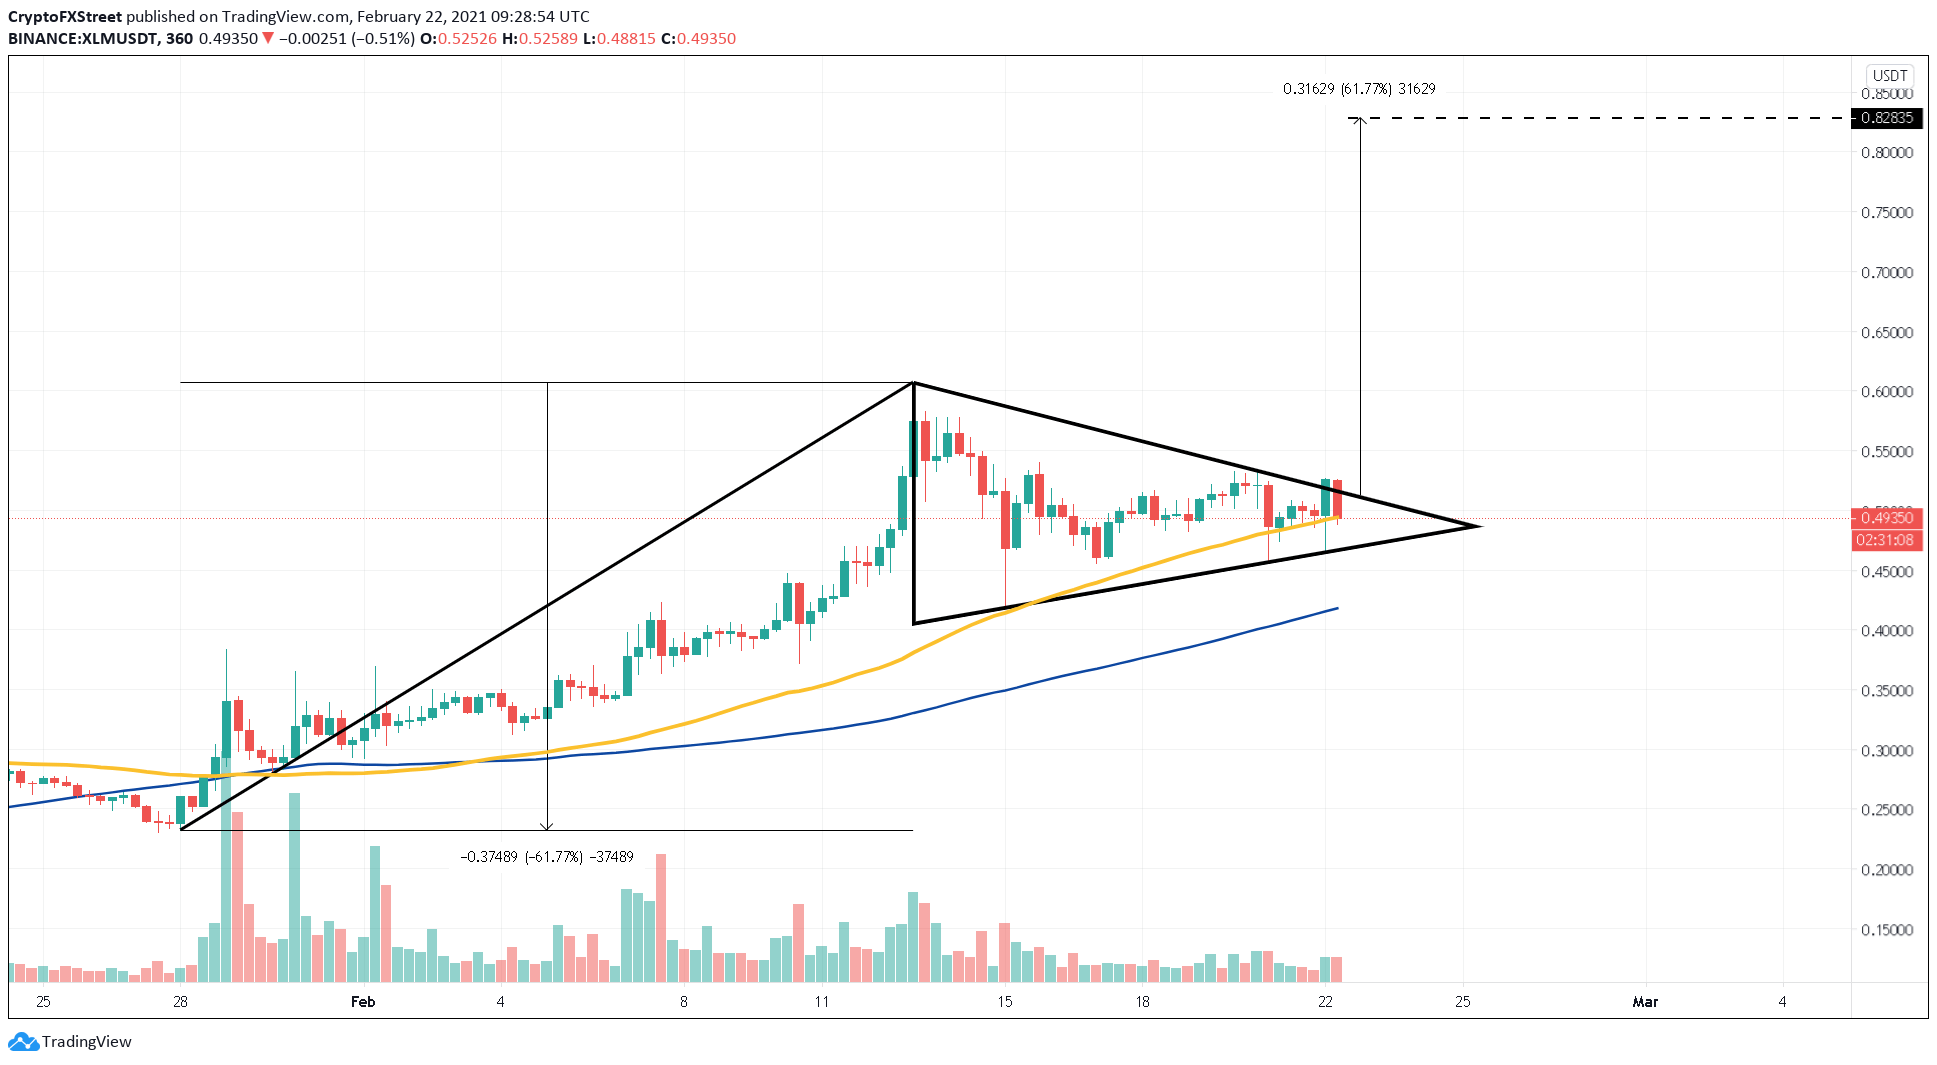
XLM/USDT 6-hour chart
Adding credence to this bullish outlook is the increase in developer activity metric. This metric shows a 45% increase in the last six days while the price has remained relatively the same, suggesting that it might not be priced-in.
Usually, investors perceive a spike in this metric as bullish as it could mean a new update or developmental rollout for the project.
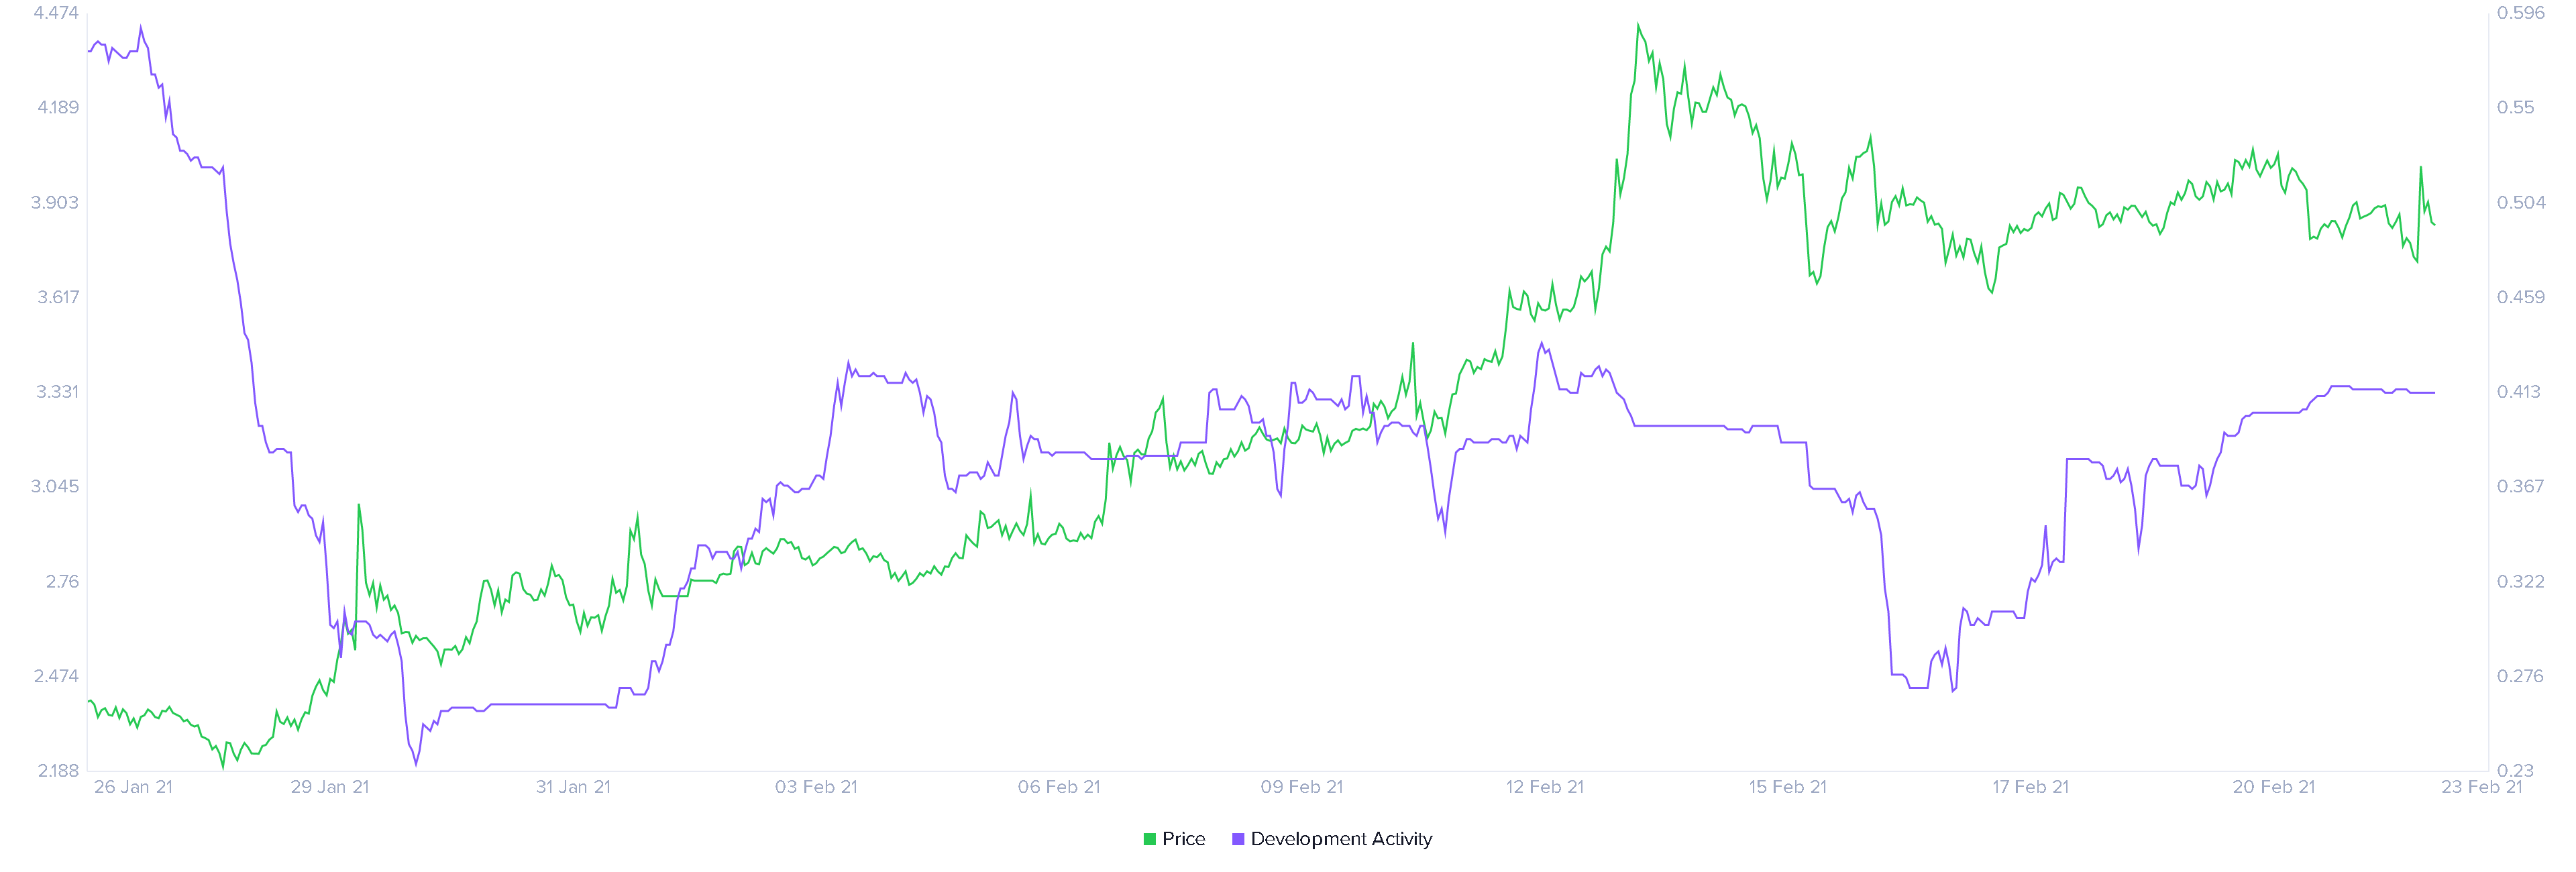
Stellar developer activity chart
On the other hand, a breakdown of Stellar price below the six-hour 50 moving average (MA) at $0.49 would be the first indication of mounting selling pressure. Moreover, a six-hour candlestick close below the pennant at $0.46 would invalidate the bullish outlook and suggest the dawn of a downtrend.
This resulting selling pressure would trigger a 10% correction up to the 100 six-hour MA at $0.41.
Author

Akash Girimath
FXStreet
Akash Girimath is a Mechanical Engineer interested in the chaos of the financial markets. Trying to make sense of this convoluted yet fascinating space, he switched his engineering job to become a crypto reporter and analyst.


