- XLM price is consolidating inside a bull flag pattern after the recent market crash.
- The Tom DeMarket Sequential indicator has flashed a buy signal hinting at a reversal of bearish momentum.
- A decisive close above the flag at $0.47 opens the possibility of a 60% bull rally.
XLM price is recovering after dropping nearly 42% from February 22 to 23. Regardless of the short-term bearish pressure, both technical and on-chain indicators suggest that bulls will push Stellar higher.
XLM price needs to blast through stiff resistance
XLM price action witnessed from late January to-date has resulted in the formation of a bull flag pattern. The initial 165% upswing from $0.23 to $0.60 created the “flag pole,” while the consolidation from $0.60 to $0.34 via a series of lower highs and lower lows has formed the “flag.”
This setup forecasts a 60% surge, which is determined by measuring the flag pole’s length and adding it to the breakout point at $0.47. If validated by an increase in buying pressure, XLM price could rise to $0.77.
The Tom DeMark (TD) Sequential indicator adds credence to the optimistic outlook. This technical index presented a buy signal on XLM’s 4-hour chart, anticipating a one to four candlesticks upswing.
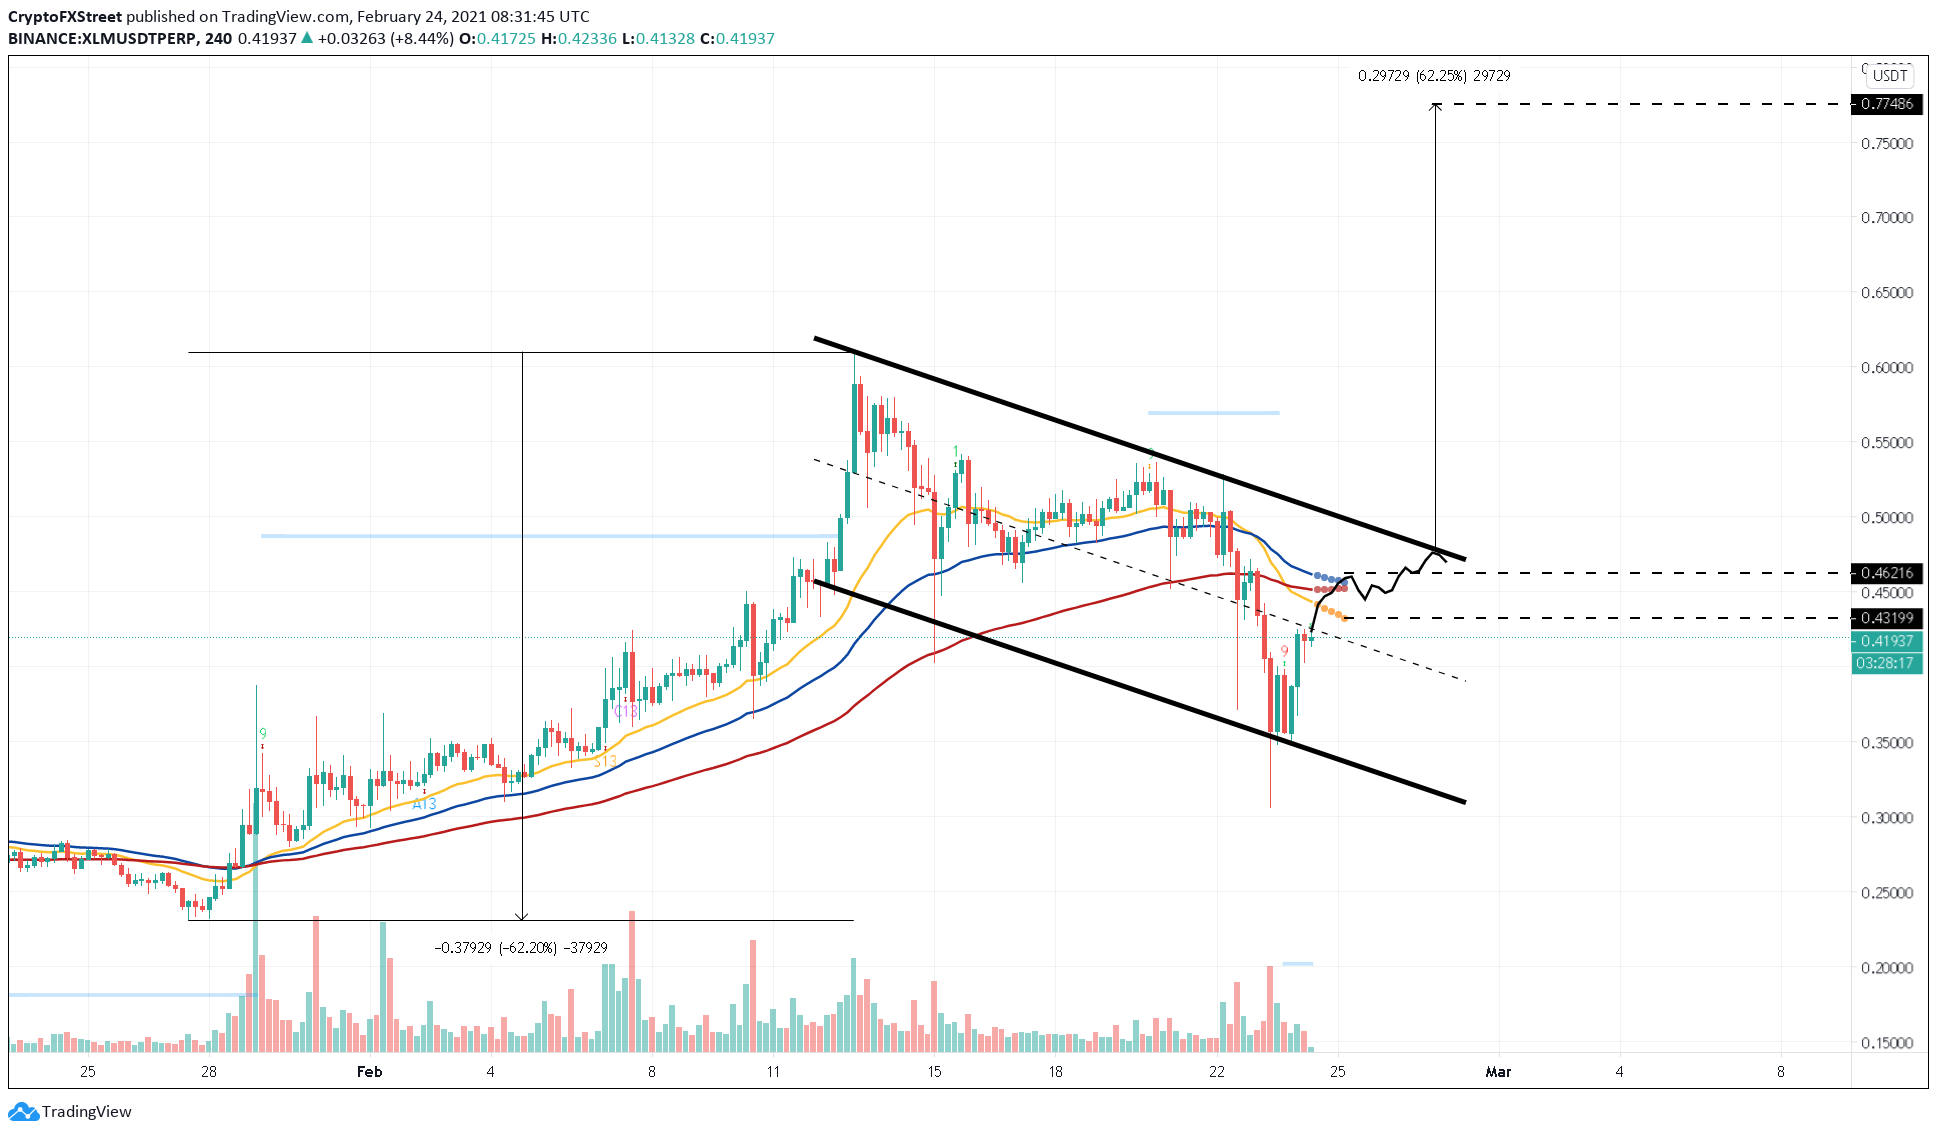
XLM/USDT 4-hour chart
In addition to the technicals, on-chain metrics are also painting a bullish scenario for XLM price.
For example, Stellar’s on-chain volume saw a 47% increase on February 22. This metric rose another 15% from $2.8 billion to $3.2 billion in the next two days, showing healthy network activity.
In the meantime, XLM price dropped, creating a bullish divergence against its on-chain volume.
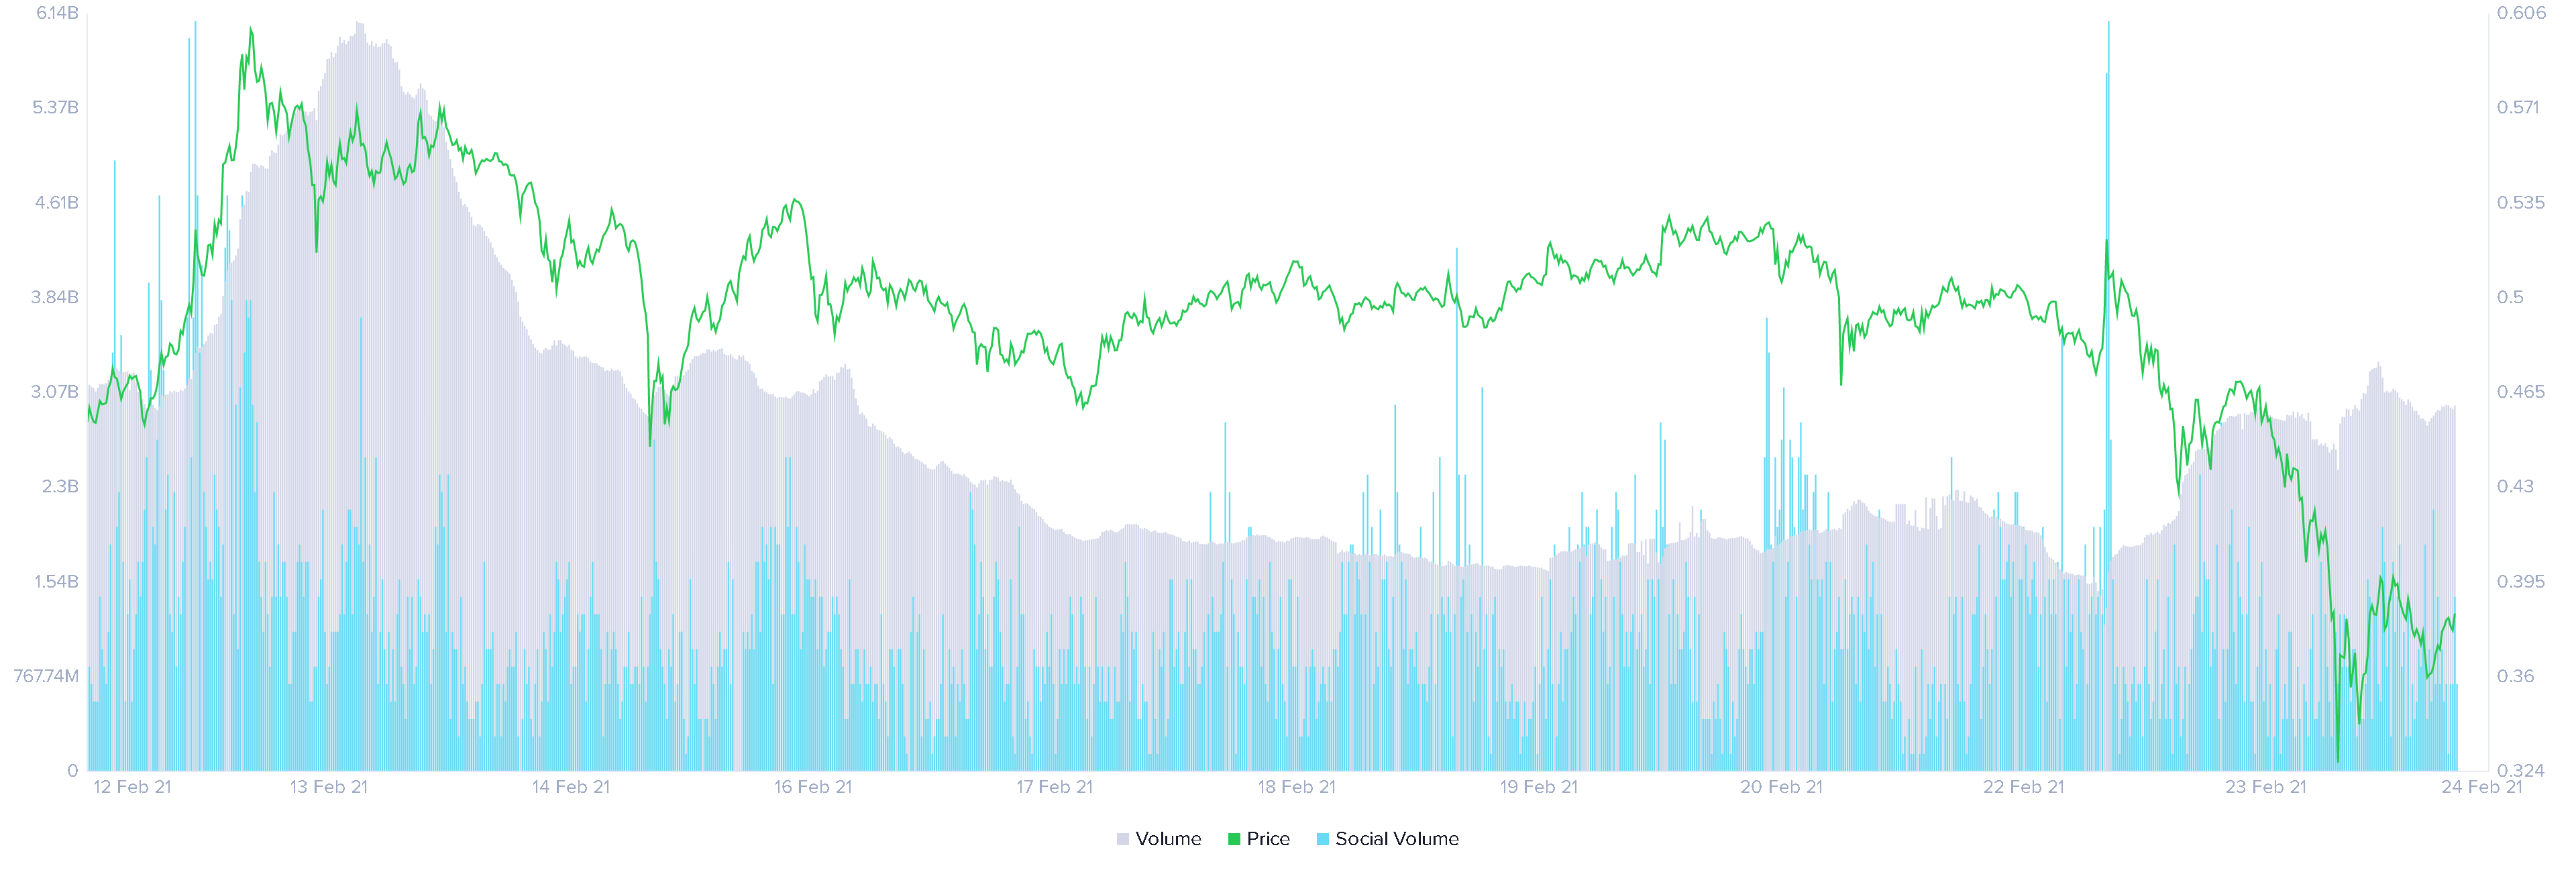
XLM on-chain volume chart
The recent 32% upswing in development activity fuels the bullish narrative as well. Investors tend to see an increase in this metric as a buy signal since it usually leads to a protocol update, product launch, or some sort of important announcement.
When considering the technical and on-chain metrics previously evaluated, it seems like Stellar price is poised for an upswing.
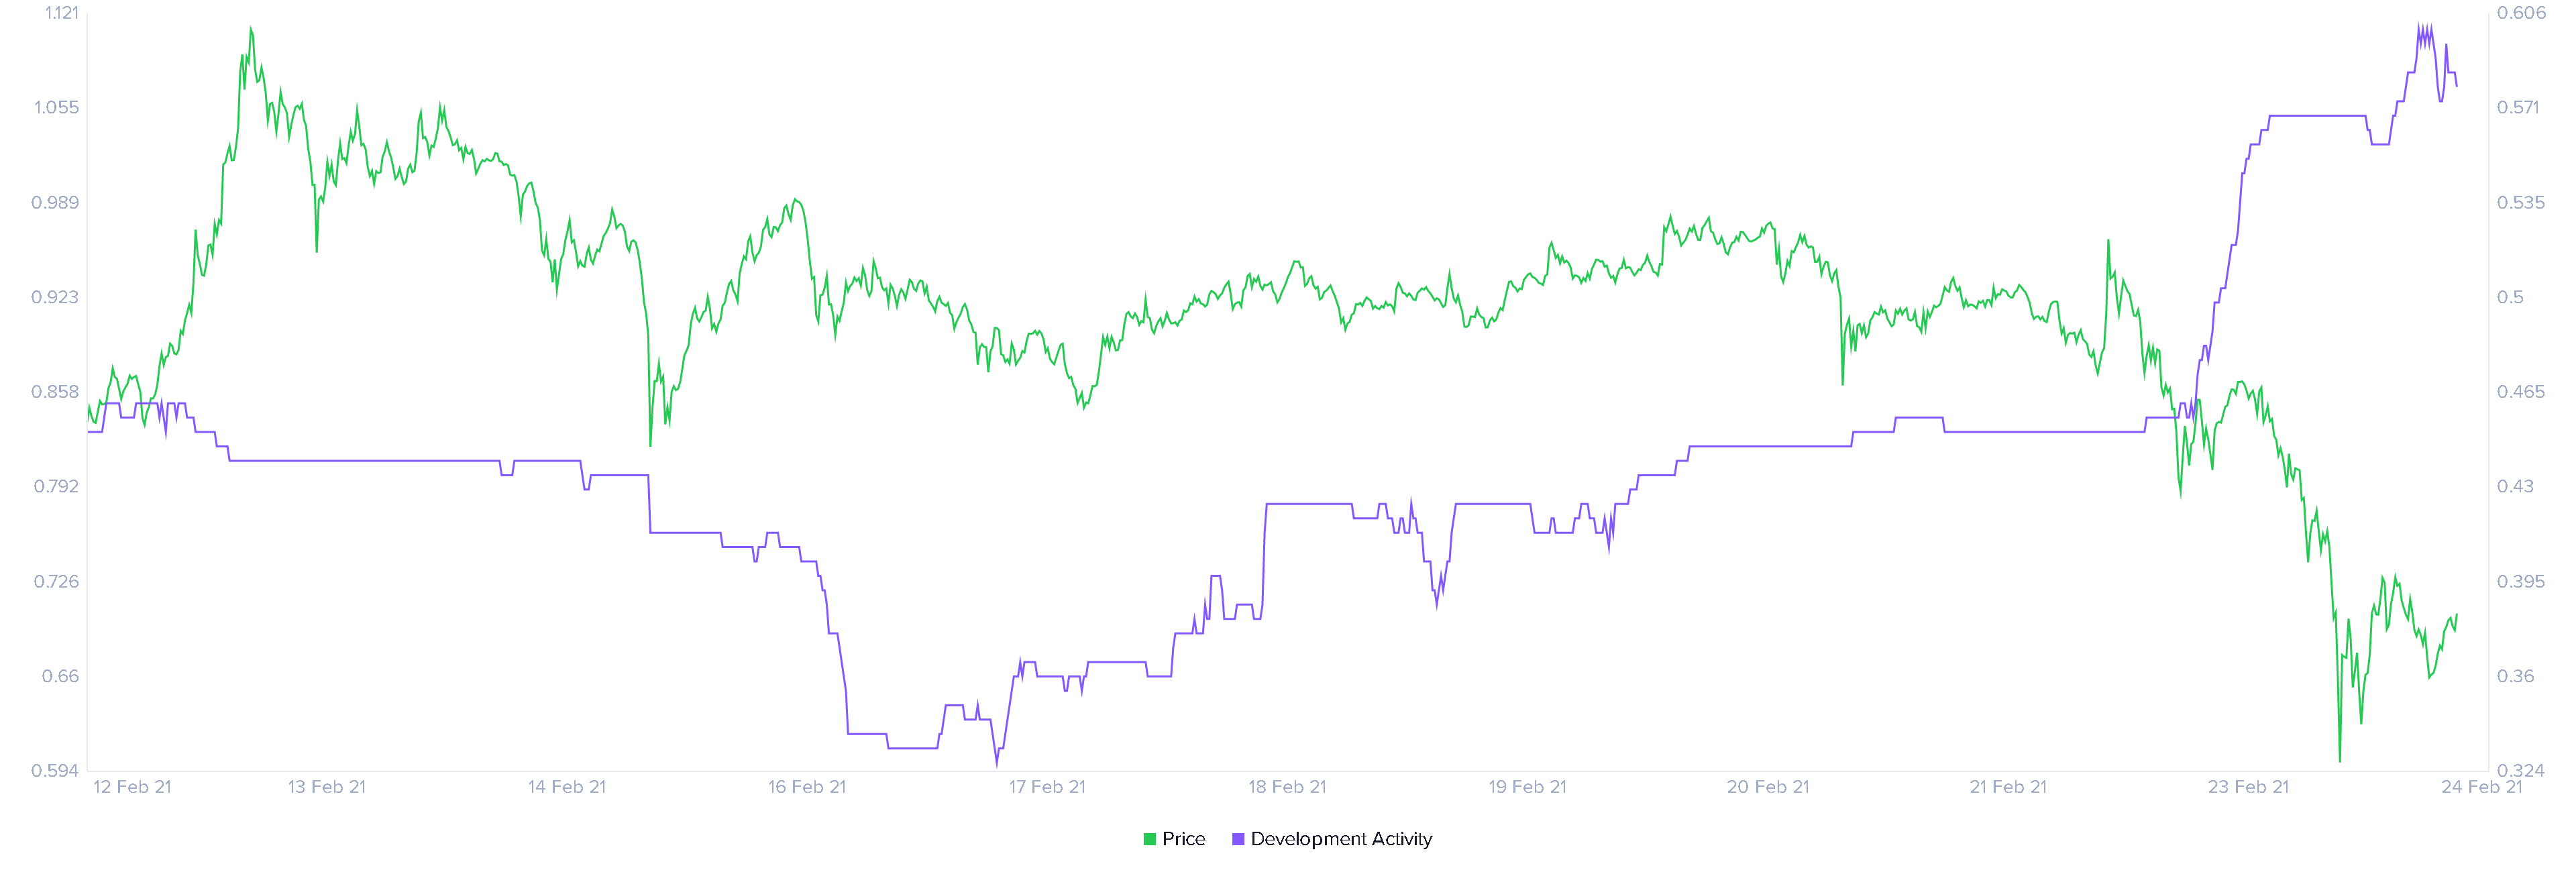
XLM developer activity chart
Regardless, investors should note the presence of a cluster of resistance barriers ranging from $0.43 to $0.46, formed by the short, mid, and long-length exponential moving averages (EMA). Rejection at this cluster could delay the bull flag’s breakout.
But if XLM price slices through the support barrier at $0.35, it would invalidate the bullish thesis and trigger another sell-off.
Information on these pages contains forward-looking statements that involve risks and uncertainties. Markets and instruments profiled on this page are for informational purposes only and should not in any way come across as a recommendation to buy or sell in these assets. You should do your own thorough research before making any investment decisions. FXStreet does not in any way guarantee that this information is free from mistakes, errors, or material misstatements. It also does not guarantee that this information is of a timely nature. Investing in Open Markets involves a great deal of risk, including the loss of all or a portion of your investment, as well as emotional distress. All risks, losses and costs associated with investing, including total loss of principal, are your responsibility. The views and opinions expressed in this article are those of the authors and do not necessarily reflect the official policy or position of FXStreet nor its advertisers. The author will not be held responsible for information that is found at the end of links posted on this page.
If not otherwise explicitly mentioned in the body of the article, at the time of writing, the author has no position in any stock mentioned in this article and no business relationship with any company mentioned. The author has not received compensation for writing this article, other than from FXStreet.
FXStreet and the author do not provide personalized recommendations. The author makes no representations as to the accuracy, completeness, or suitability of this information. FXStreet and the author will not be liable for any errors, omissions or any losses, injuries or damages arising from this information and its display or use. Errors and omissions excepted.
The author and FXStreet are not registered investment advisors and nothing in this article is intended to be investment advice.
Recommended Content
Editors’ Picks
Prisma price tanks 25% after nearly $9 million exploit
Prisma Finance (PRISMA) is being exploited, and the attacker has so far pulled $9 million in Ethereum from the borrowing protocol. Prisma asked vault owners to take the necessary steps to protect funds from the ongoing attack in an official tweet on X.
Meme coins gain traction after SEC’s partial win in Coinbase lawsuit: DOGE, SHIB, BRETT, POPCAT, BODEN
US SEC pocketed a partial win in its lawsuit against Coinbase, ushering a correction in crypto prices on Thursday. Despite the broad pullback, prices of meme coins like Dogecoin, Shiba Inu and Solana-based BRETT, POPCAT and BODEN increased.
Ondo moves $95 million worth of OUSG assets to BUIDL as tokenized fund attracts $245 million since debut
Ondo Finance (ONDO) announced on Wednesday that it's shifting about $95 million worth of its OUSG's underlying assets to the BlackRock USD Institutional Digital Liquidity Fund (BUIDL).
XRP price stuck below $0.65 resistance, Ripple lawsuit could suffer from Coinbase defeat
XRP price falls slightly to $0.61 on Thursday after its landmark programmatic sales ruling in July, which gave Ripple a partial victory against the US SEC, failed to reverberate in a similar legal battle between the regulator and crypto exchange Coinbase.
Bitcoin: BTC may have recovered, but is it out of the woods?
Bitcoin’s (BTC) upward momentum has shown a significant decline for the past two weeks or so. This development led to a bearish signal on the weekly and an uncertain outlook on the monthly.