|

XLM Price Analysis: Stellar massive 30% breakout was stopped abruptly, signaling weakness

  • XLM price had a significant 30% breakout above a descending triangle pattern on the 12-hour chart.
  • The digital asset topped out at $0.38 before plummeting.
  • It seems that the breakout wasn't as strong as the bulls hoped. 

XLM price topped out at $0.411 on January 7 and has been under consolidation since then. After a significant breakout that started on January 28, the digital asset hit $0.383 but quickly dropped towards $0.291. 

XLM price could be poised for a deeper fall

After a successful breakout above the resistance trendline at $0.29, XLM price jumped by 30% but saw a massive rejection at $0.383 and dropped to $0.291 within the next 12 hours. This massive dive shows that the breakout, although meeting its target, couldn’t hold at that level.

xlm price

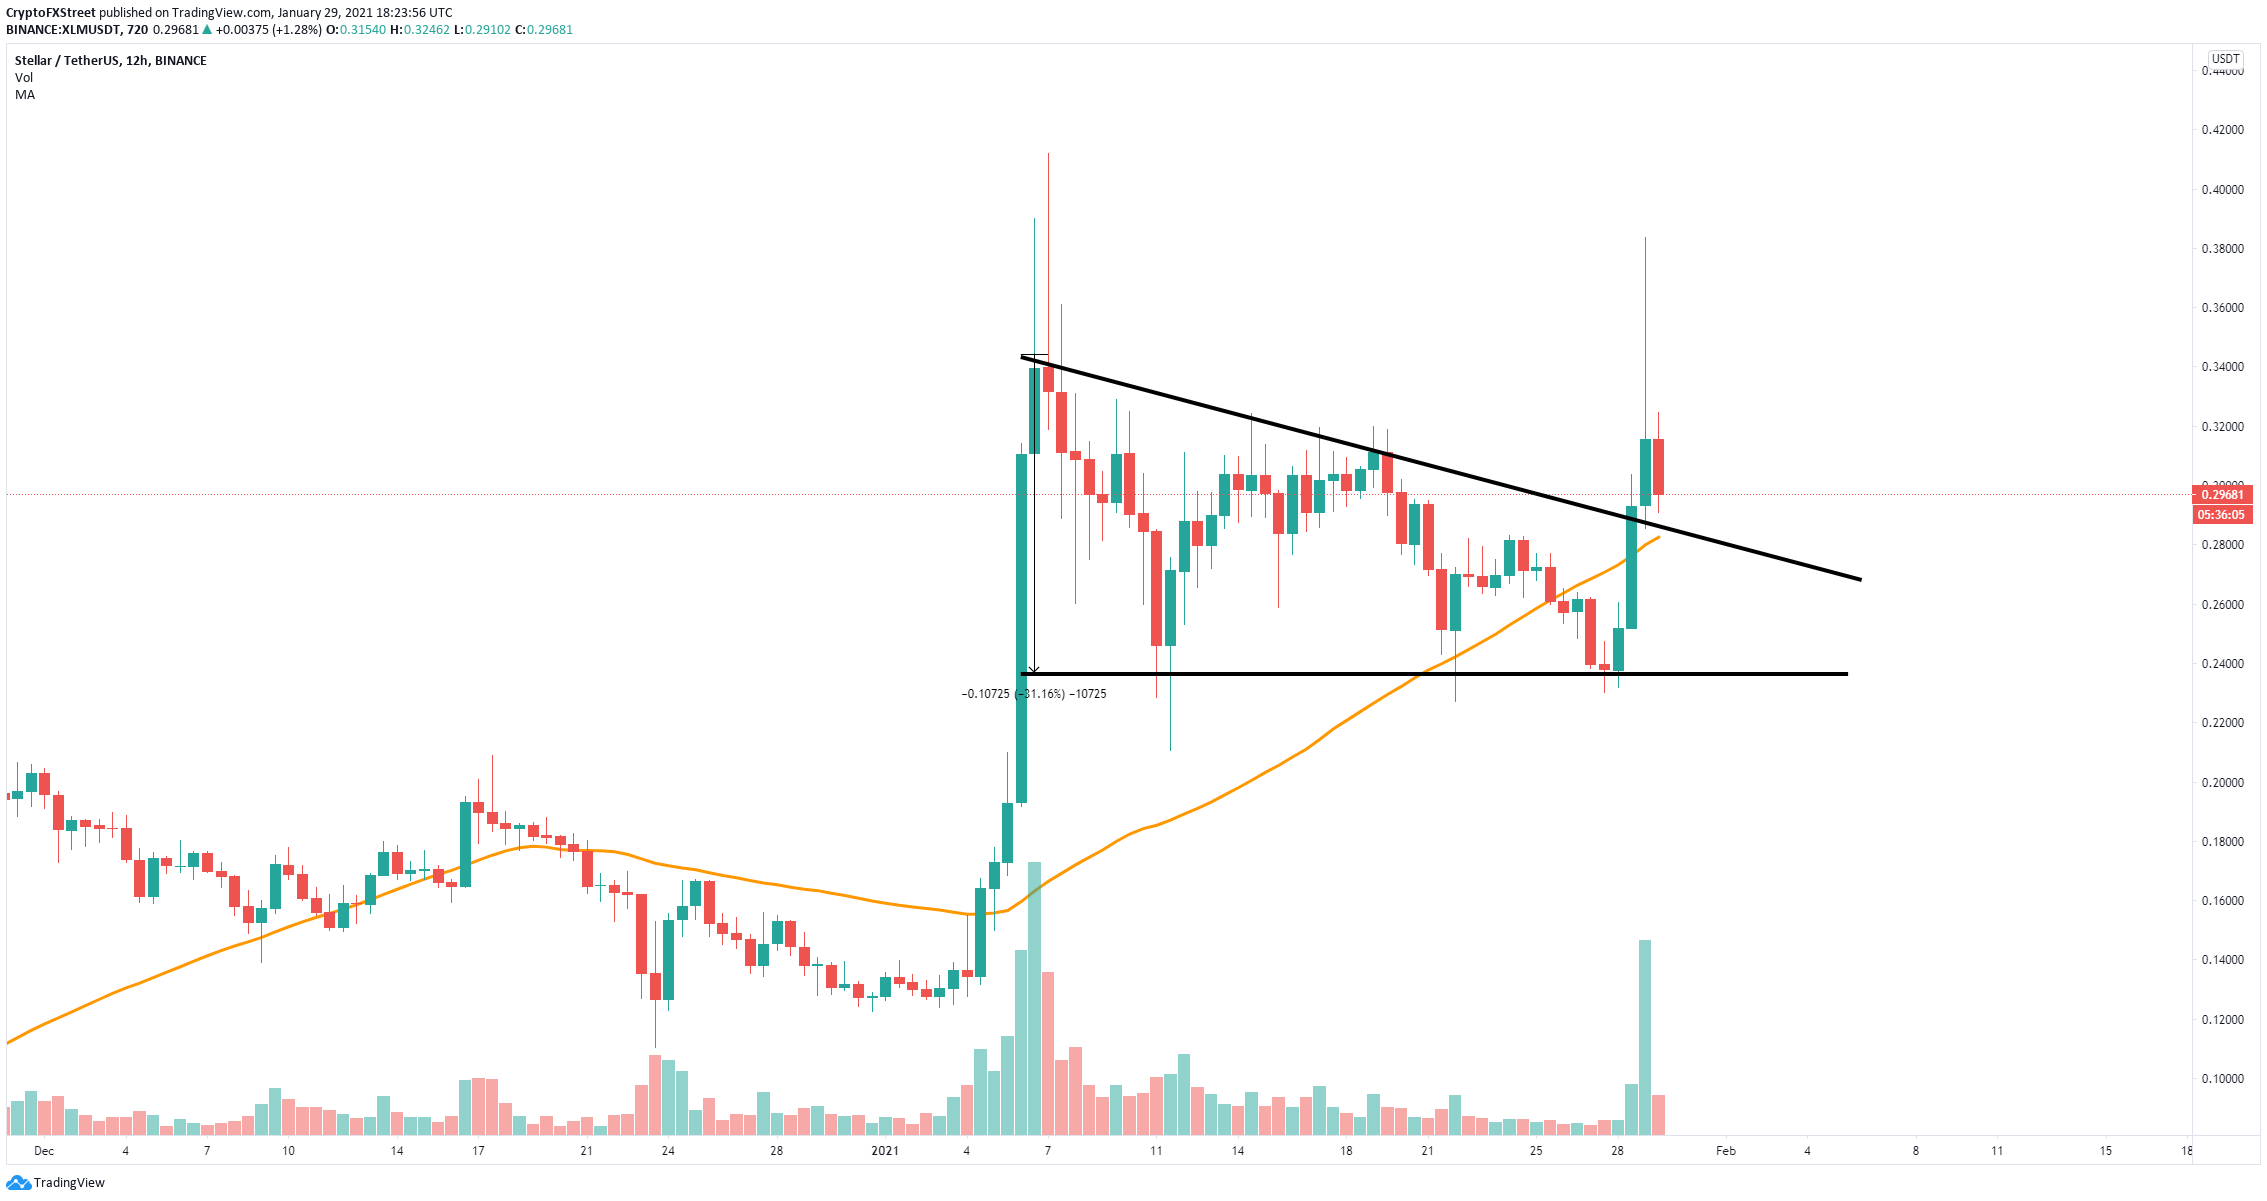
XLM/USD 12-hour chart

The previous resistance trendline at $0.29 which now coincides with the 50-SMA is a support level. Failure to hold this point will drive XLM price down to $0.235. 

xlm price

XLM sell signals

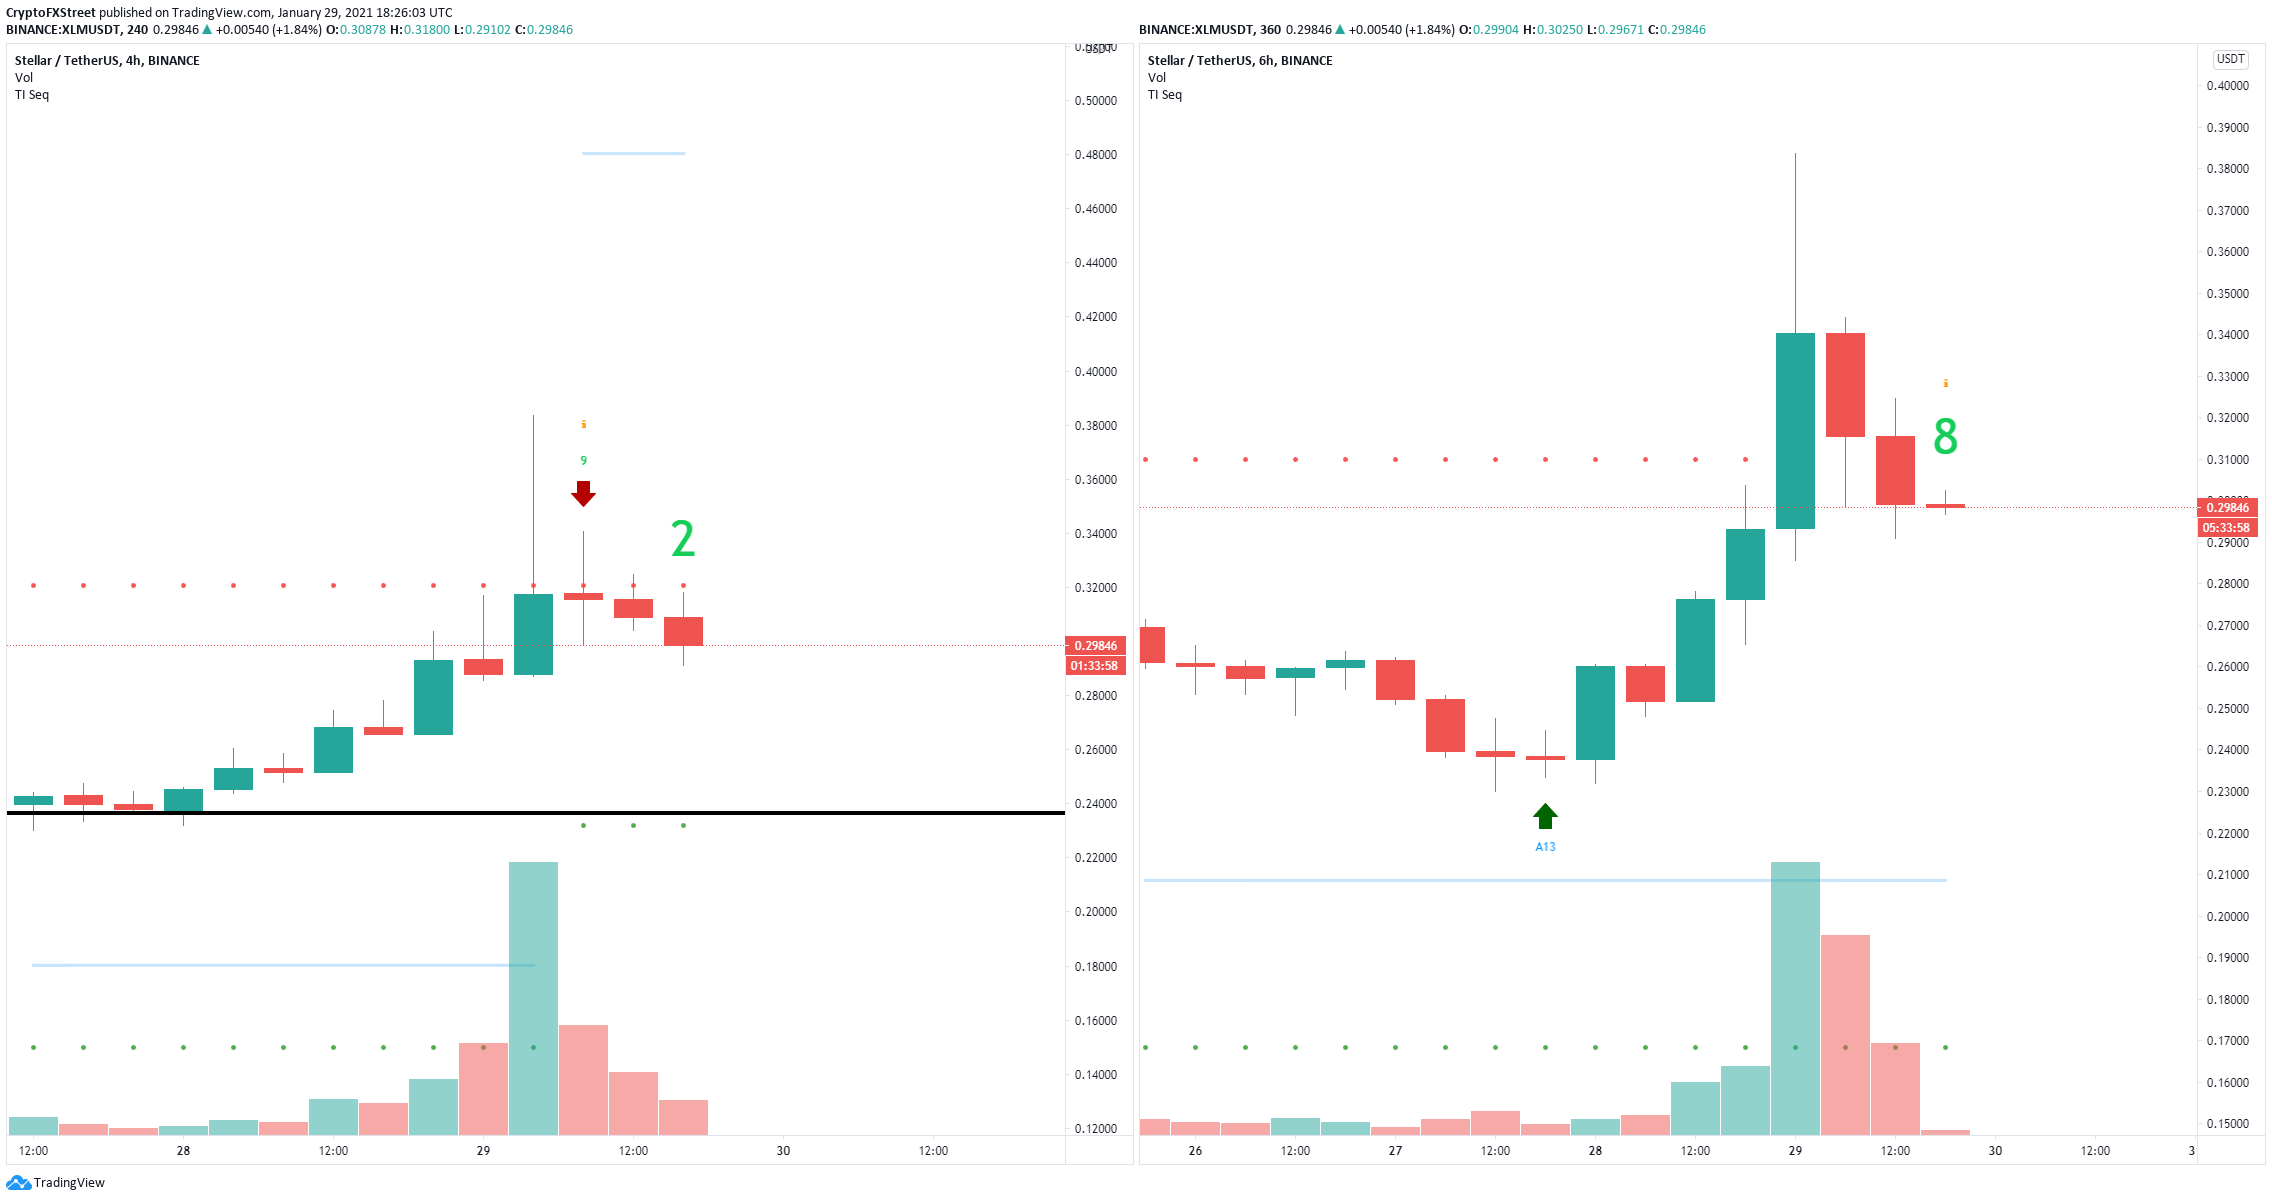
Additionally, the TD Sequential indicator has presented a sell signal on the 4-hour chart which had a lot of continuation and it’s about to exhibit the same call on the 6-hour chart, adding even more credence to the bearish outlook.

However, despite the significant crash in the past 24 hours, if the bulls can defend $0.29, the price target remains at $0.38 in the long-term. 

Author

Lorenzo Stroe

Lorenzo Stroe

Independent Analyst

Lorenzo is an experienced Technical Analyst and Content Writer who has been working in the cryptocurrency industry since 2012. He also has a passion for trading.

More from Lorenzo Stroe
Share:

Editor's Picks

Ripple ticks up as buyers re-engage

Ripple trends higher at the time of writing on Thursday, trading above $1.12. The cross-border remittance token seeks to erase a persistent downtrend that has weighed on the price since mid-May, as investors navigated geopolitical tensions in the Middle East.

Crypto Today: Bitcoin, Ethereum, XRP rebound broadens despite continued US-Iran strikes

Bitcoin steadies its recovery on Thursday, edging higher toward $63,000 despite incessant capital outflows. Meanwhile, altcoins, including Ethereum and Ripple, exhibit subtle rebound signs, trading above $1,650 and $1.12, respectively.

Bitcoin stages modest rebound ahead of US PPI data

Bitcoin recovers slightly, trading above $62,500 on Thursday after three consecutive days of losses. US-listed spot ETFs recorded outflows of $213.85 million on Wednesday, indicating persistent withdrawals amid renewed US-Iran tensions.

Pi Network: Recovery at risk with 16 million PI tokens ready for unlock

Pi Network edges higher on Thursday after three days of consecutive losses earlier this week, extending the prevailing downtrend since late April. The scheduled unlocking of 16 million PI tokens on Thursday could add pressure to the intraday recovery.

Bitcoin: After the bloodbath, everyone looks at $60,000
Bitcoin (BTC) hovers above $62,000 at the time of writing on Friday, weighed down by growing risk-off sentiment due to persistent geopolitical tensions in the Middle East and sticky macroeconomic uncertainty. The institutional sell-off continued to wreak havoc on capital flows, with spot Bitcoin Exchange-Traded Funds (ETFs) recording billions in outflows.