Why Solana price will struggle to return to $100
- Solana price action is relatively weak compared to its peers.
- Selling pressure was immediate upon reaching a critical Ichimoku resistance level.
- Sideways price action is likely while market participants digest last week's flash crash.

Solana price made some significant gains from its new nine-month and 2022 lows last week. However, the bounce from the lows has been somewhat muted compared to Bitcoin and the broader altcoin market.
Solana price struggles to maintain gains made over the weekend
Solana price experienced the same dramatic swings in price action last week that the broader crypto market experienced. After hitting a new 2022 low of $37.37 on May 12, SOL rallied over 57% to close just shy of $60 at $58.83 on Sunday. Further upside momentum was terminated upon hitting the daily Tenkan-Sen.
Between May 12 and May 14, there were significant gaps between the bodies of the Solana price daily candlesticks and the Tenkan-Sen. Within the Ichimoku Kinko Hyo system, large gaps between candlestick bodies and the Tenkan-Sen are not tolerated for very long and often return to equilibrium between four to six candlesticks. So a strong back to the Tenkan-Sen was not unexpected.
Likewise, the selling pressure of Solana price at the Tenkan-Sen should not be unexpected. There is a very subtle hidden bearish divergence between the daily candlestick chart and the Composite Index. Hidden divergence occurs when the price chart displays lower highs while an oscillator shows higher highs. Hidden bearish divergence warns that the current upswing will likely terminate, and the dominant downtrend will continue.
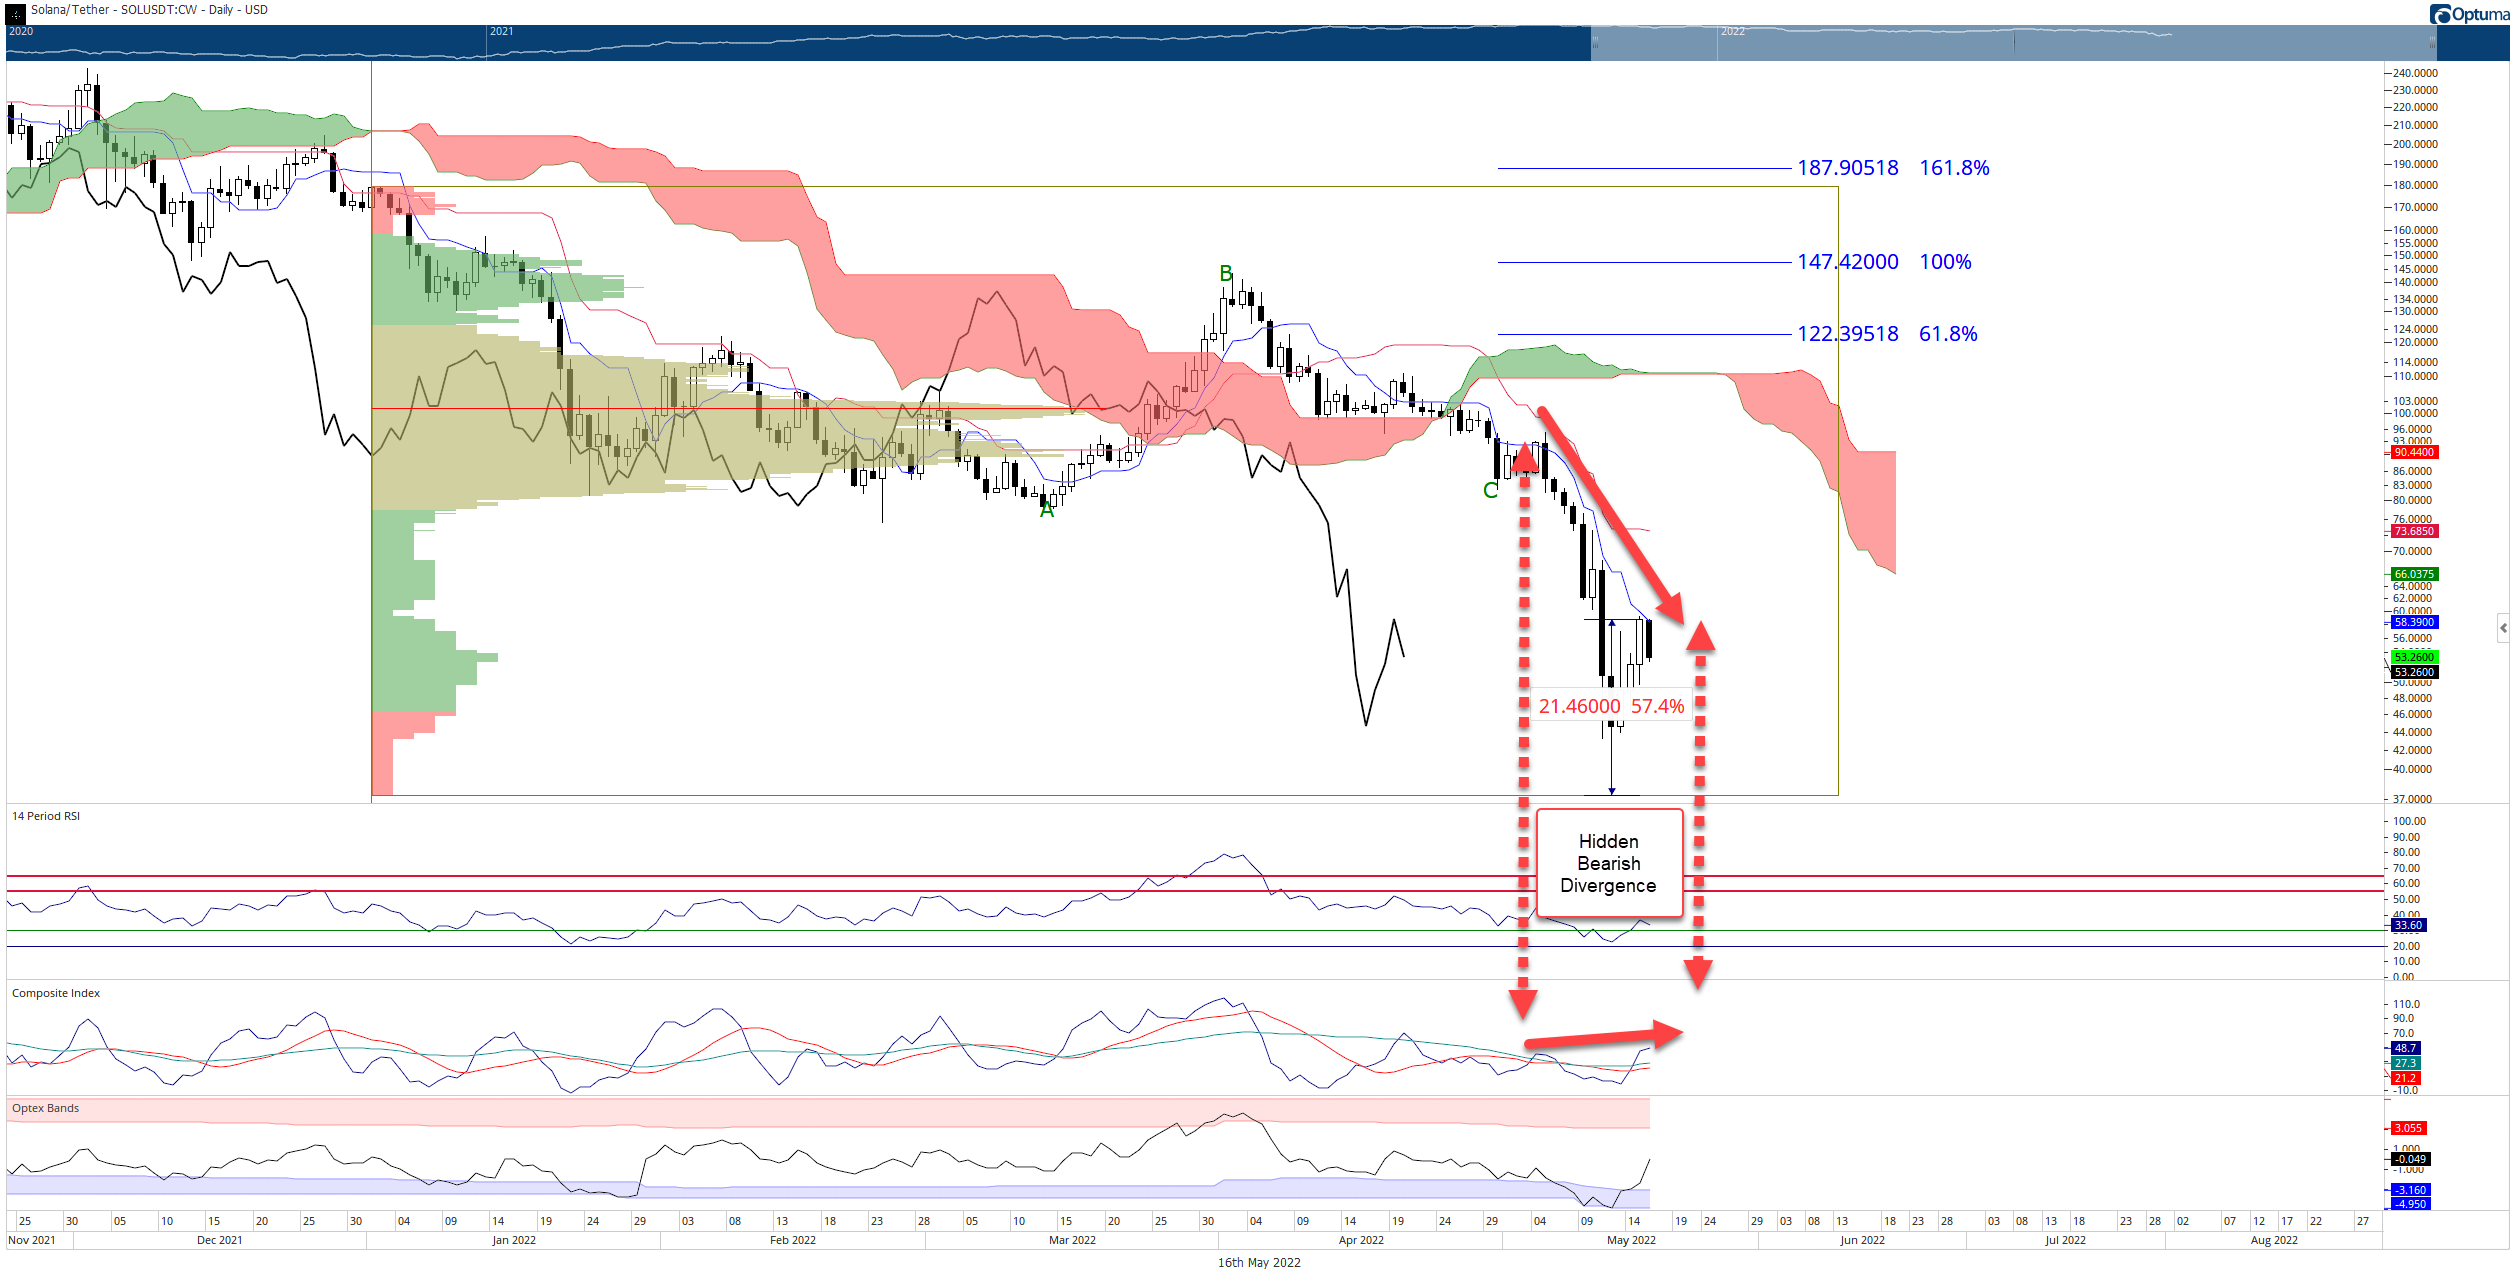
SOL/USDT Daily Ichimoku Kinko Hyo Chart
However, a return to the nine-month and new 2022 lows near $37 is not a foregone conclusion. Solana price reached excessively oversold conditions last week on the daily and weekly charts. In addition, the flash crash last week fulfilled a retracement between the extremely thin 2021 Volume Profile high volume nodes of $135 and the 2021 Volume Point of Control at $37.36.
Some consolidation of price action after a 57% gain should be expected before Solana price resumes its uptrend to retest the 2022 Volume Point of Control at $100. Solana price will likely face considerable resistance at the 50% Fibonacci retracement and weekly Tenkan-Sen in the $75 value area, and again at the 61.8% Fibonacci retracement at $84.
Depending on how long SOL consolidates, $84 could also contain the weekly Kijun-Sen, further exacerbating the resistance at that level.Downside risks are likely limited to the current 2022 lows in the $37 value area.
Author

Jonathan Morgan
Independent Analyst
Jonathan has been working as an Independent future, forex, and cryptocurrency trader and analyst for 8 years. He also has been writing for the past 5 years.



