- Polygon price action has been flip-flopping between profit and loss this week.
- MATIC price could be seeing the end of the summer rally as tailwinds look to be diminishing.
- Should bulls go in too aggressively for the pop above $0.96, expect to see a violent squeeze and bull trap.
Polygon (MATIC) price action has been on treading nervously this week, with weekly earnings switching back and forth between profit and loss. It all comes down to trading this Friday to see if bulls can eke out a winning week. Along with that comes the risk they might be in for a negative treat if they go in for the pop above $0.96, where bears will be waiting with a bull trap and squeeze back towards $0.80. On the other hand, patient bulls calmly riding out the bullish triangle formation will be rewarded with a profit near $1.10.
MATIC price sounding the alarm for a bull trap
Polygon price sees bulls eagerly attempting to eke out a weekly gain in the price action, which is quite understandable given the summer rally since the beginning of July. Along with that strategy comes a risk of overshooting as bulls will try to break and close above July 20, 2021, high and possibly even target $1.00. But it is probably too soon to expect, as the summer period is trading on thinner liquidity. From a technical point of view, the bullish triangle also has plenty of room to go before triggering a breakout.
MATIC price could see bears coming in hard on a break above $0.96. Bulls could get trapped on their entries in the break above $0.96 and see their positions pulled down towards $0.80 near the monthly pivot and the green ascending trend line. That would be a roughly 17% negative carry, which plenty of bulls will cut beforehand, giving bears free room to move in.
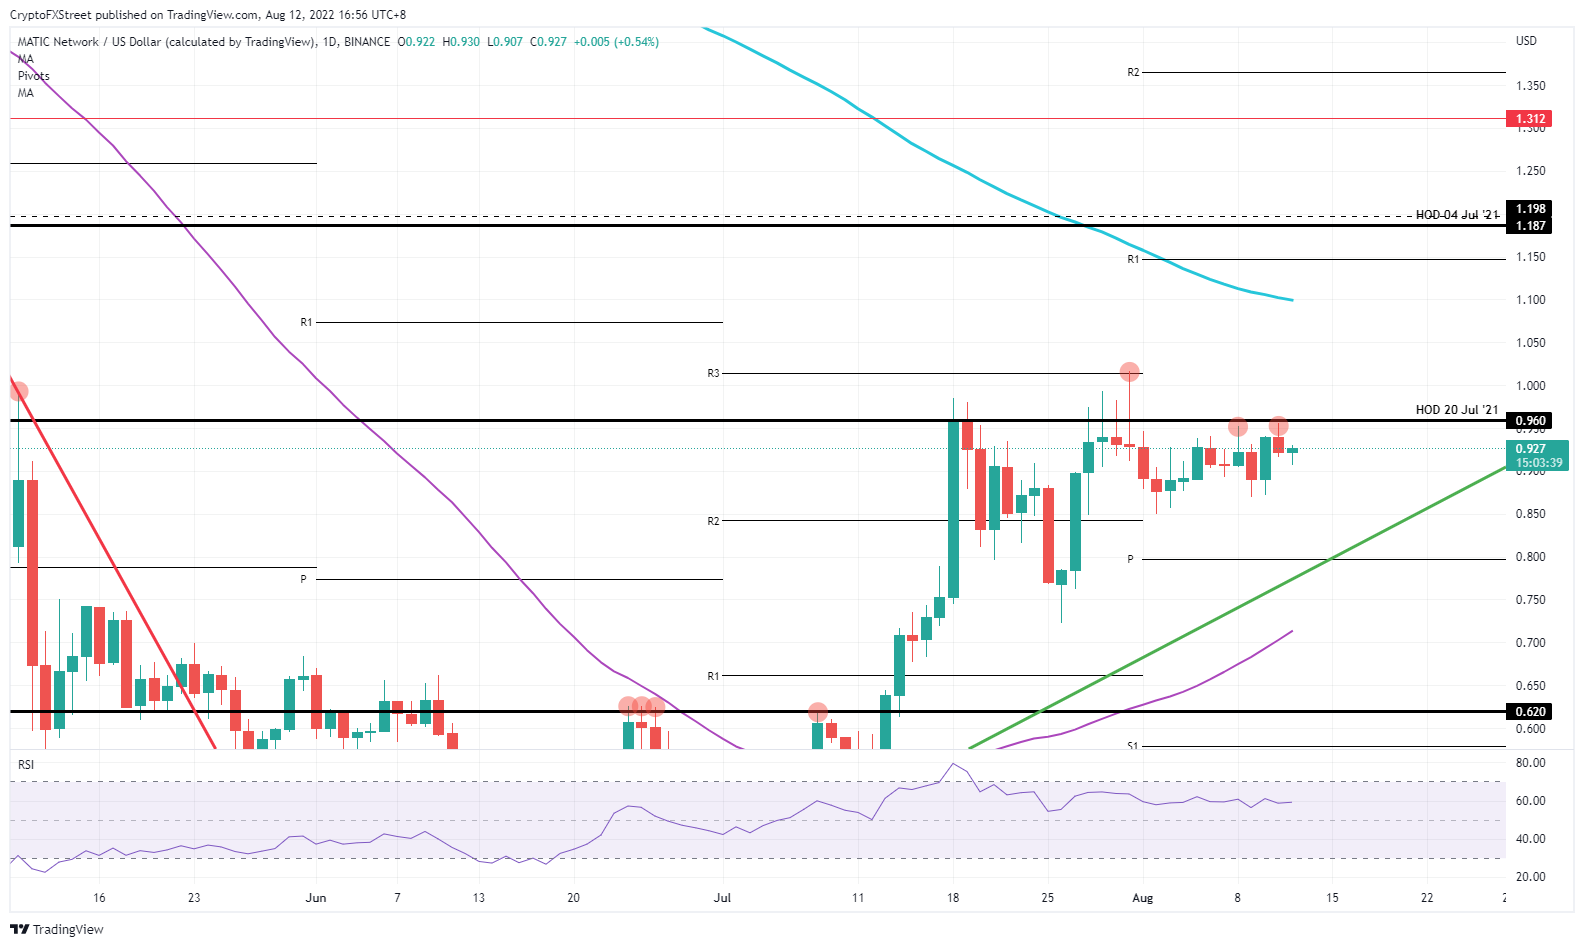
MATIC/USD Daily chart
Several traders will have identified the bullish triangle with the green ascending trend line and the High of July 20, 2021, as a base for the triangle. Expect a return towards more support around $0.80-$0.90 soon, depending on the timing, to scope up some more investors and provide fuel for the breakout. Anything sooner could be, as mentioned in the above paragraph, likely short-lived.
Information on these pages contains forward-looking statements that involve risks and uncertainties. Markets and instruments profiled on this page are for informational purposes only and should not in any way come across as a recommendation to buy or sell in these assets. You should do your own thorough research before making any investment decisions. FXStreet does not in any way guarantee that this information is free from mistakes, errors, or material misstatements. It also does not guarantee that this information is of a timely nature. Investing in Open Markets involves a great deal of risk, including the loss of all or a portion of your investment, as well as emotional distress. All risks, losses and costs associated with investing, including total loss of principal, are your responsibility. The views and opinions expressed in this article are those of the authors and do not necessarily reflect the official policy or position of FXStreet nor its advertisers. The author will not be held responsible for information that is found at the end of links posted on this page.
If not otherwise explicitly mentioned in the body of the article, at the time of writing, the author has no position in any stock mentioned in this article and no business relationship with any company mentioned. The author has not received compensation for writing this article, other than from FXStreet.
FXStreet and the author do not provide personalized recommendations. The author makes no representations as to the accuracy, completeness, or suitability of this information. FXStreet and the author will not be liable for any errors, omissions or any losses, injuries or damages arising from this information and its display or use. Errors and omissions excepted.
The author and FXStreet are not registered investment advisors and nothing in this article is intended to be investment advice.
Recommended Content
Editors’ Picks
Space ID price succumbs to selling pressure with $3.54 million worth of ID tokens unlocked in a cliff event

Space ID (ID) price remains bullish based on the Parabolic SAR price-tracking indicator, which continues to track ID price from below. However, the token is trading at a value that is significantly lower than its rate 24 hours ago, an outcome attributed to its scheduled token unlocks event.
Quant price maintains steady multi-month downtrend but 60% of QNT holders remain above water

Quant (QNT) price is trading with a bearish bias, a steady state that has prevailed for the most part of the year. Despite the downtrend, the majority of QNT token holders remain above water, sitting on unrealized profit.
Optimism receives backlash after decision to split 116 million OP tokens for treasury management

Optimism network recently announced the sale of 116 million OP tokens valued at around $162.4 million in a private sale to seven purchasers for treasury management. While the transaction was not expected to impact OP price, it has provoked backlash from onlookers.
Binance unintentionally causes Ethereum gas fees to soar 1,900% as hundreds of inactive wallets move ETH

With many transfers happening within a thin timeframe, Ethereum gas fees soared 1,900%, moving from 15 to around 300 Gwei. The same was reflected in simple Peer-to-Peer (P2P) transactions, which soared from the conventional 40 cents to around $10, data from Dune analytics shows.
Bitcoin: BTC contemplates crash in September

Bitcoin price remains unfazed by the US CPI announcement on September 13 and continues to move in a range. The weekly chart, however, shows a potential short-term recovery rally that could set the stage for a steep correction.