XRP remains below $2.00 amid increasing bearish risks, waning retail demand
- XRP remains above $1.82 support amid persistent bearish signals and a 14% downward risk.
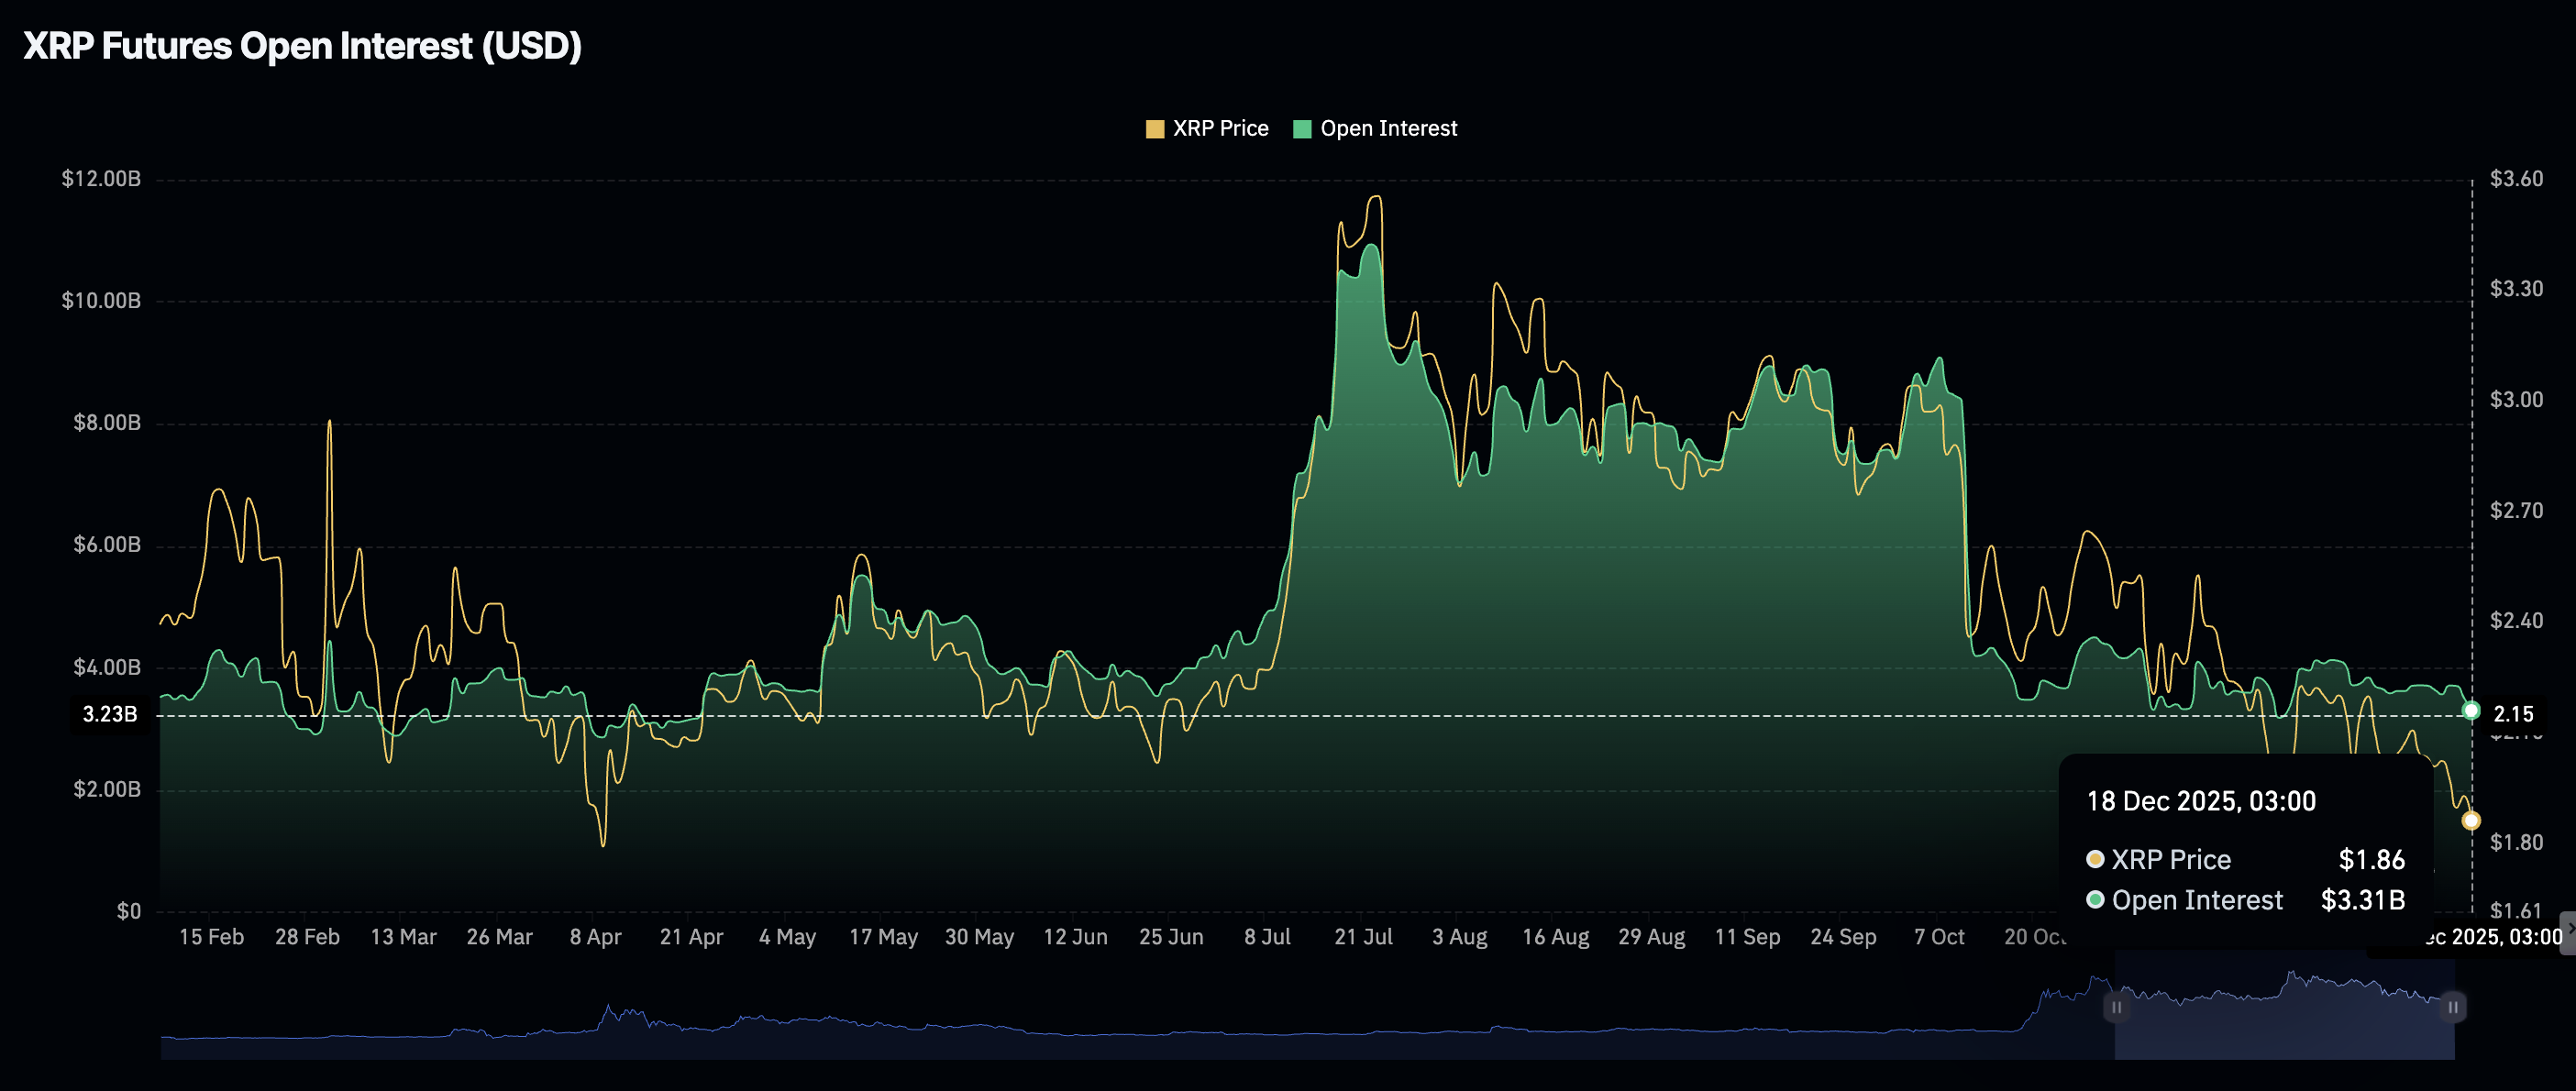
- Retail demand dwindles, as reflected by futures Open Interest shrinking to $3.31 billion.
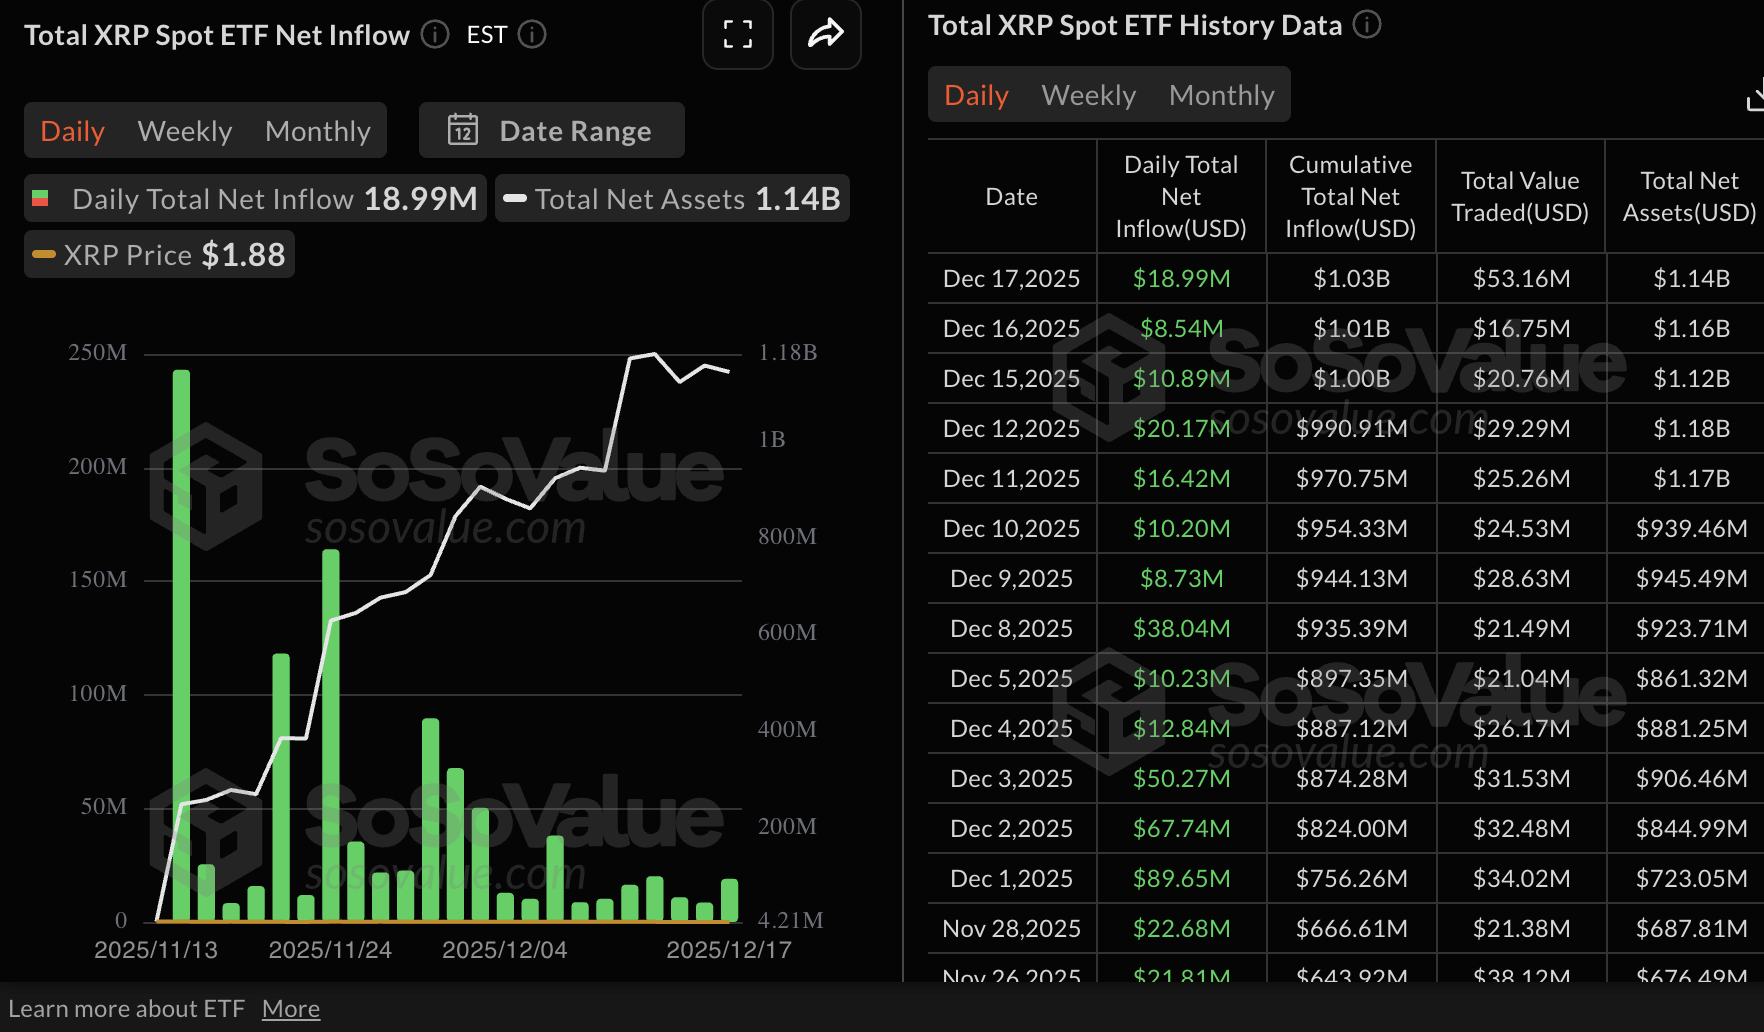
- XRP’s $18 million inflow into US-listed ETFs fails to trigger a price recovery, signaling broader risk-off sentiment.

Ripple (XRP) is trading between a key support at $1.82 and resistance at $2.00 at the time of writing on Thursday, reflecting the lethargic sentiment in the broader cryptocurrency market.
Despite the cross-border token holding above the immediate support, which was also tested on November 21, the overall outlook remains bearish, as reflected by waning retail interest.
XRP falters as retail demand narrows
XRP is facing a significant drop in retail interest, which is negatively affecting the derivatives market and, on a larger scale, triggering frequent sell-offs. CoinGlass data shows futures Open Interest (OI) at $3.31 billion on Thursday, down from $3.52 billion the previous day and $3.71 billion on Tuesday.
Since the October 10 flash crash, the derivatives market has remained significantly suppressed, with OI fluctuating between $3 billion and $4 billion. Before the deleveraging event, OI stood at $8.36 billion, which emphasizes the prevailing low retail interest and demand.
A sustained uptick in the OI is needed to support steady price increases. Otherwise, recovery could remain a pipe dream, as investors stay on the sidelines.
On the other hand, institutional investors have, since the debut of XRP spot Exchange Traded Funds (ETFs) in the United States (US), shown immense interest in the token, characterised by persistent inflows.
XRP ETFs recorded approximately $18 million in inflows on Wednesday, a significant increase from the $8.5 million posted on Tuesday. The cumulative net inflow stands at $1.03 billion, with net assets at $1.14 billion, according to SoSoValue data.
Steady ETF inflows support positive sentiment, potentially making XRP attractive not only to institutional investors but also to retail traders.
Technical outlook: XRP trades under pressure as downside risks escalate
XRP is trading above support at $1.82 at the time of writing, while its upside has been capped below $2.00. The token also sits below the downtrending 50-day Exponential Moving Average (EMA) at $2.17, the 100-day EMA at $2.35 and the 200-day EMA at $2.43, affirming the bearish outlook.
The Moving Average Convergence Divergence (MACD) indicator on the daily chart has maintained a sell signal since Tuesday, prompting investors to reduce exposure. Red histogram bars below the mean line are expanding, suggesting that sellers have the upper hand.
Although the Relative Strength Index (RSI) on the same chart has stabilized at 35, it remains within the bearish region. If the RSI declines further into oversold territory, headwinds may trigger a 14% correction to XRP toward April’s low of $1.61.
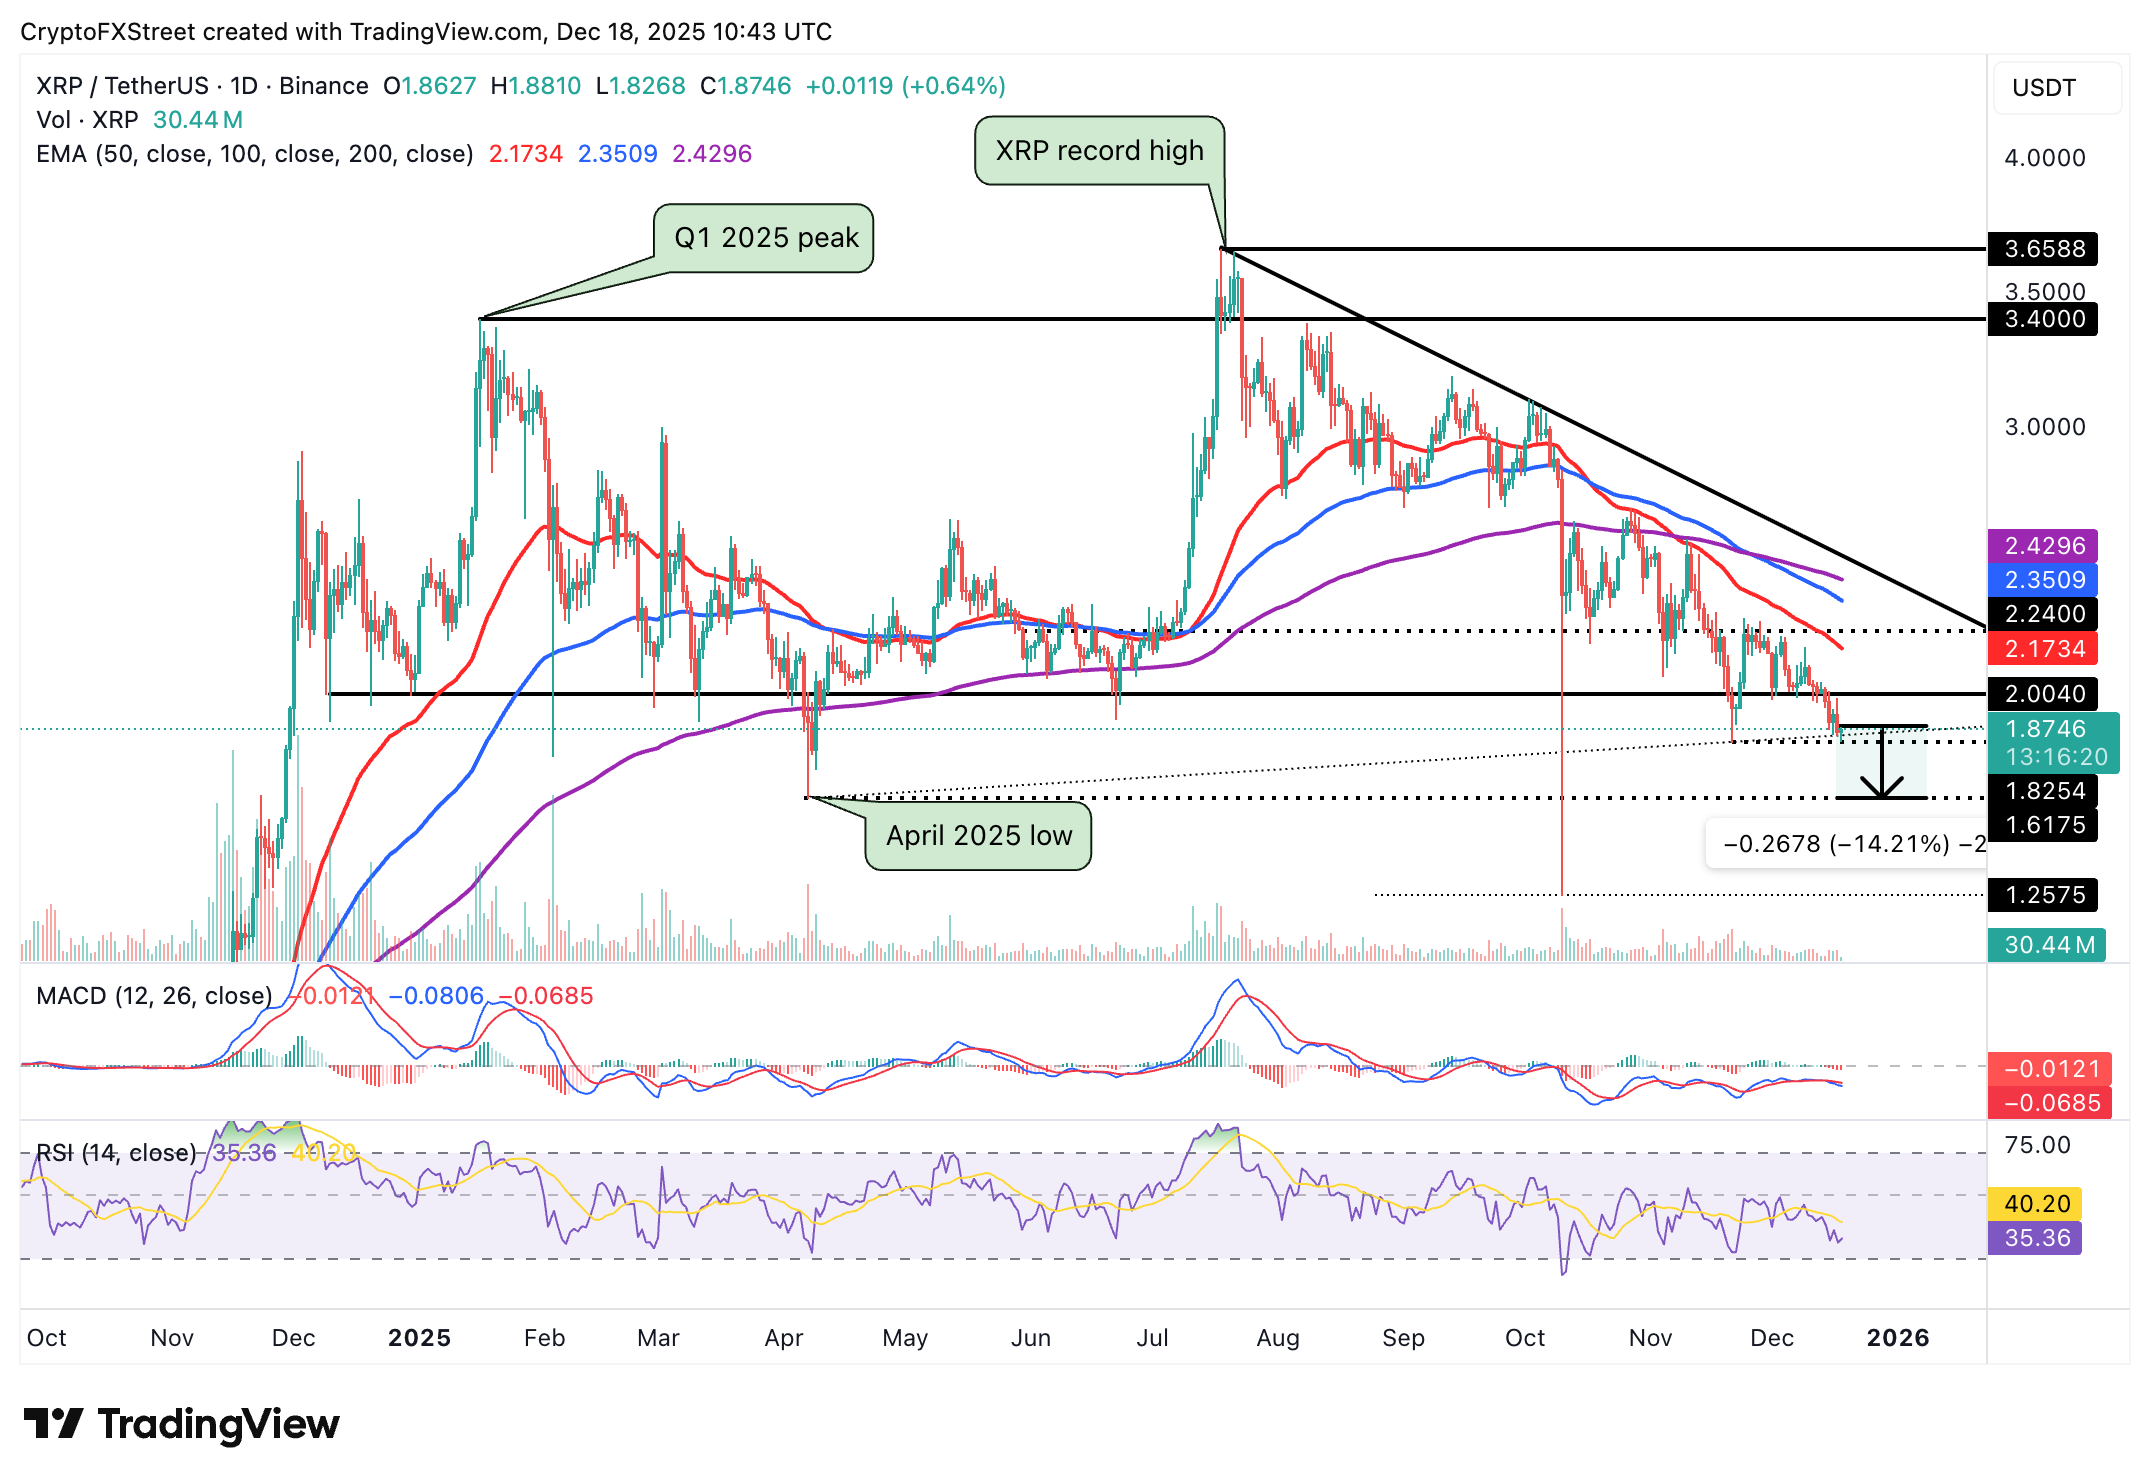
Still, the immediate support at $1.82 could work as a shield against further selling, prompting investors to increase exposure. A close above $2.00 could mark the first step toward a potential bullish turnaround. The 50-day EMA at $2.17 should be reclaimed as support, bolstering a bullish outlook above the descending trendline.
Open Interest, funding rate FAQs
Higher Open Interest is associated with higher liquidity and new capital inflow to the market. This is considered the equivalent of increase in efficiency and the ongoing trend continues. When Open Interest decreases, it is considered a sign of liquidation in the market, investors are leaving and the overall demand for an asset is on a decline, fueling a bearish sentiment among investors.
Funding fees bridge the difference between spot prices and prices of futures contracts of an asset by increasing liquidation risks faced by traders. A consistently high and positive funding rate implies there is a bullish sentiment among market participants and there is an expectation of a price hike. A consistently negative funding rate for an asset implies a bearish sentiment, indicating that traders expect the cryptocurrency’s price to fall and a bearish trend reversal is likely to occur.
Author

John Isige
FXStreet
John Isige is a seasoned cryptocurrency journalist and markets analyst committed to delivering high-quality, actionable insights tailored to traders, investors, and crypto enthusiasts. He enjoys deep dives into emerging Web3 tren


