Cryptosummer is about to get hotter with another 25% of profit in Polygon's MATIC
- Polygon price set to perform bullish breakout.
- MATIC is already up 80% since July and is set to make a 100% overall return.
- Expect to see another rally reaching $1.20.

Polygon's MATIC price is getting a nice tan in the warm summer sun as price action is pumped and set to print solid returns nearing 100%, once a technical hurdle is broken to the upside. The positive turn in sentiment coincides with the overall recovery in global markets, where equities are not yet entirely into green figures for the yearly performance, but at least the situation is not as grim and dire as it was in June. Cryptocurrencies have been supported by this recovery and have seen investors returning after a long hiatus and hibernation, back for now and putting money to work.
MATIC price sees bulls impatient to break out
Polygon price is currently moving in a longer-term bullish triangle that got identified at the beginning of July and has seen respect along the way. With global markets on the front foot, more tailwinds are coming in for cryptocurrencies, making bulls impatient and wanting to break out of the triangle even before it's completed. With the base at $0.96, investors will be awaiting the breakout to enter around $1.00 and sit on their hands as bears get squeezed out.
MATIC price could quickly spiral higher and face three levels where profit taking will occur. The first level is the 200-day Simple Moving Average, at around $1.10, which is the biggest bearish hurdle to overcome in case bulls want to make more money. The second profit-taking level hangs around $1.15 and is August's monthly R1 resistance level. Last but not least is the historic pivotal level at $1.19 which already had a double rejection back on May 04 and 05 and will undoubtedly be a bridge too far as bulls will have taken profit on the mentioned levels.
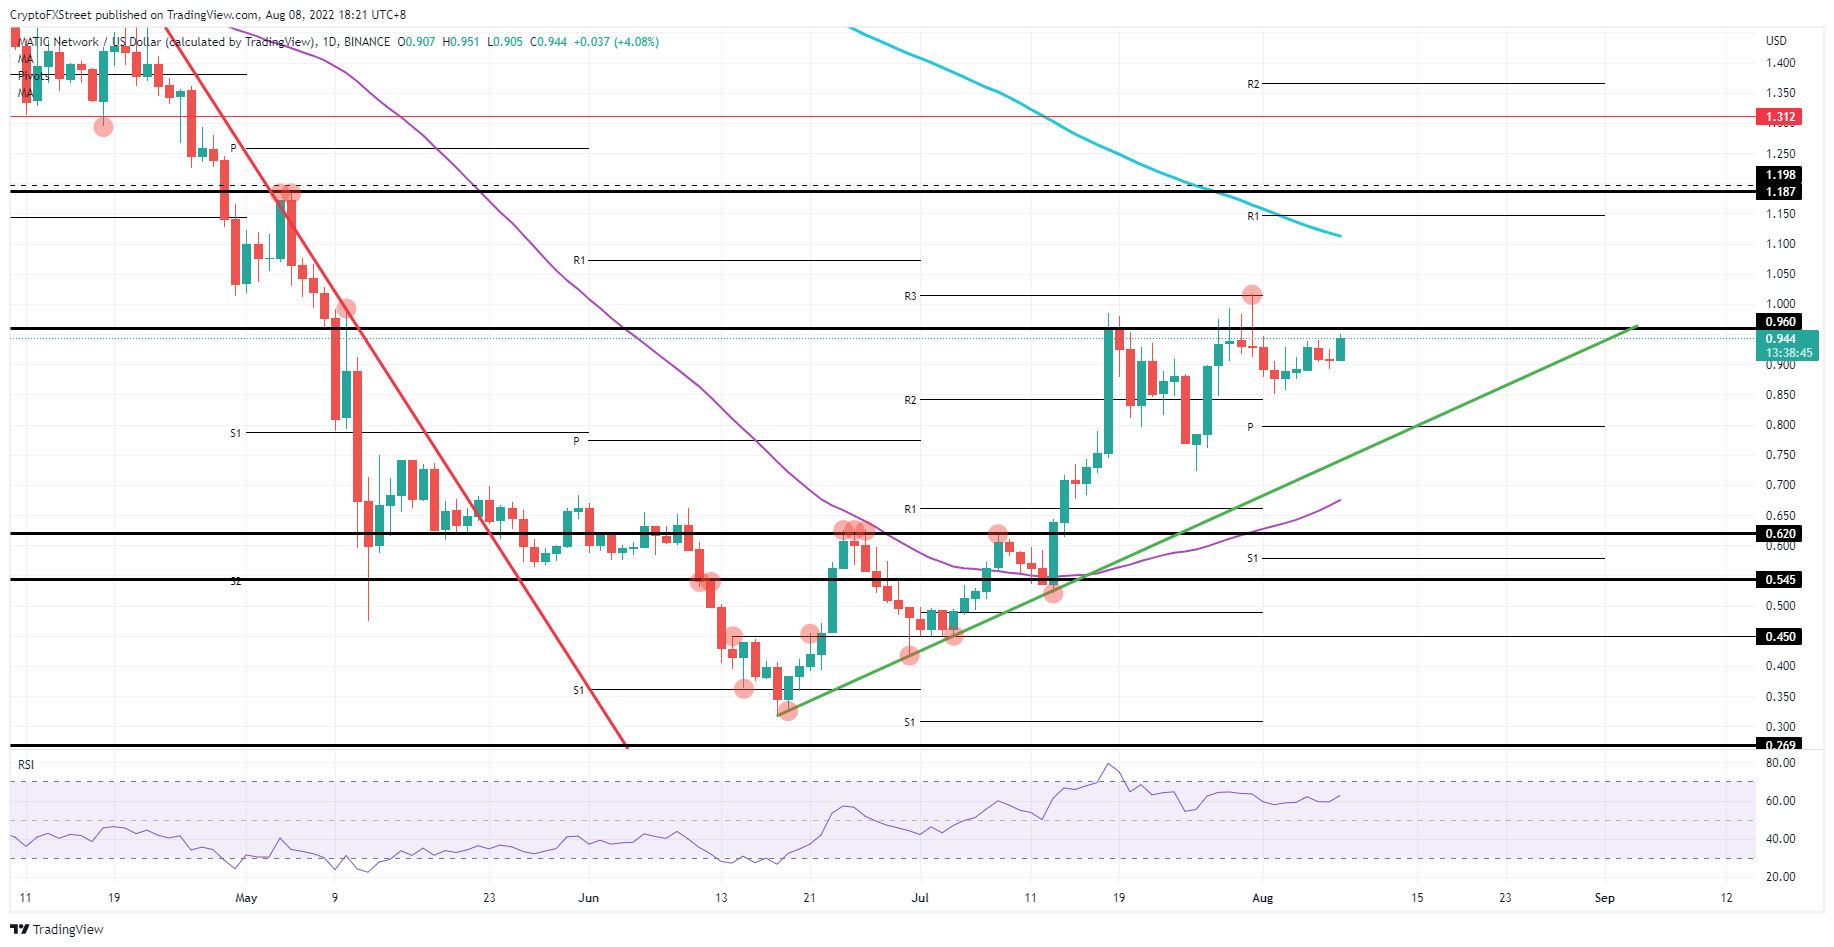
MATIC/USD Daily chart
A big fear amongst investors is that market sentiment could easily switch overnight as markets are focussing too much on the possibility that the Fed might start cutting rates in early 2023. With only a goldilocks scenario on their mind (rates are ‘just right’ for peaking inflation), investors might forget that inflation could still surprise to the upside and delay future easing. That would mean a rejection at $0.96 and a fall towards $0.80 at the monthly pivot before testing the green ascending trend line on support.
Author

Filip Lagaart
FXStreet
Filip Lagaart is a former sales/trader with over 15 years of financial markets expertise under its belt.



