Why Avalanche price is on the brink of a 22% decline
- A sell signal from the Super Trend indicator triggers Avalanche price correction from $26.
- The falling investor interest contributes to Avalanche price woes.
- The demand area at $20 could drastically change the perspective from a 22% drop to a bullish sequel.

Avalanche price towered across the cryptocurrency market, moving 58% higher from support established at the $16 price level over the last two weeks. The rally was triggered by a cap and handle pattern and bolstered by the fear of missing out (FOMO) among investors. Initially, the momentum seemed solid and unbreakable, but AVAX price got rejected at $26, which paved the way for a bearish reversal to $20.
Avalanche price eyes a 22% Drop
The Super Trend indicator presented a sell signal on Monday following the rejection at $26. Besides, Avalanche price was already struggling to retain the gains accrued over the last couple of weeks. Although the drop to $20 happened fast, substantial buyer congestion in the same zone kept the influence of bears under control.
An analysis of the Moving Average Convergence Divergence (MACD) indicator reveals that more declines will likely come into play in the coming sessions. The 12 Exponential Moving Average (EMA) has crossed beneath the 26 EMA, which is a bearish signal, as is the MACD exploring areas below the mean line. For this reason, investors should acclimatize to losses extending 22% to $16.
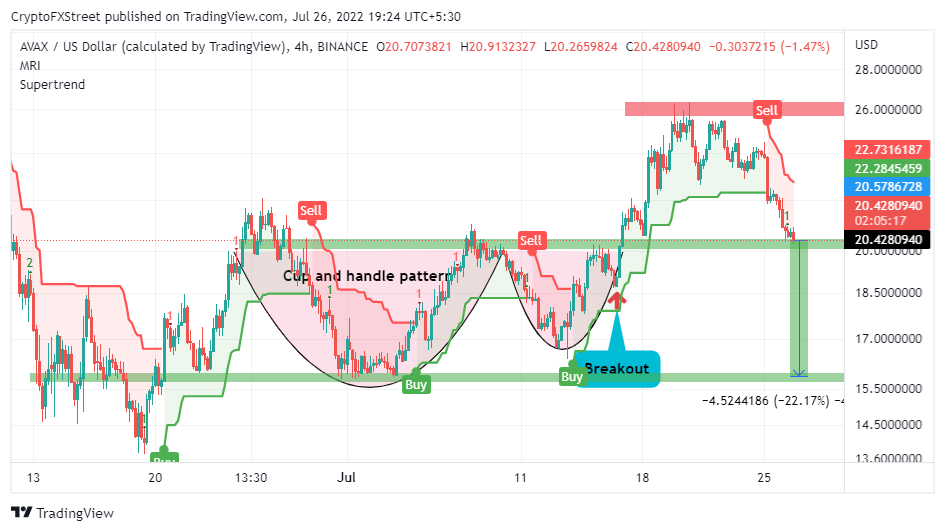
AVAX/USD four-hour chart
On-chain data from Santiment shows a significant drop in the number of AVAX mentions across multiple social media platforms. A minor spike in the volume occurred during the breakout to $26, but FOMO died down as investors booked early profits. It would be beneficial to Avalanche price if the number of mentions grew steadily. The increase in volume would sustain the uptrend’s momentum while at the same time avoiding bearish price corrections.
 [16.57.36, 26 Jul, 2022]-637944472222825290.png)
Avalanche social volume chart
On the other hand, the TD Sequential indicator has presented a buy signal on the same four-hour timeframe, implying that a bullish reversal is in the offing. A red nine candlestick reveals that bears are getting thin, and if bulls seize the opportunity, the support at $20 will be the springboard for the return to $26.
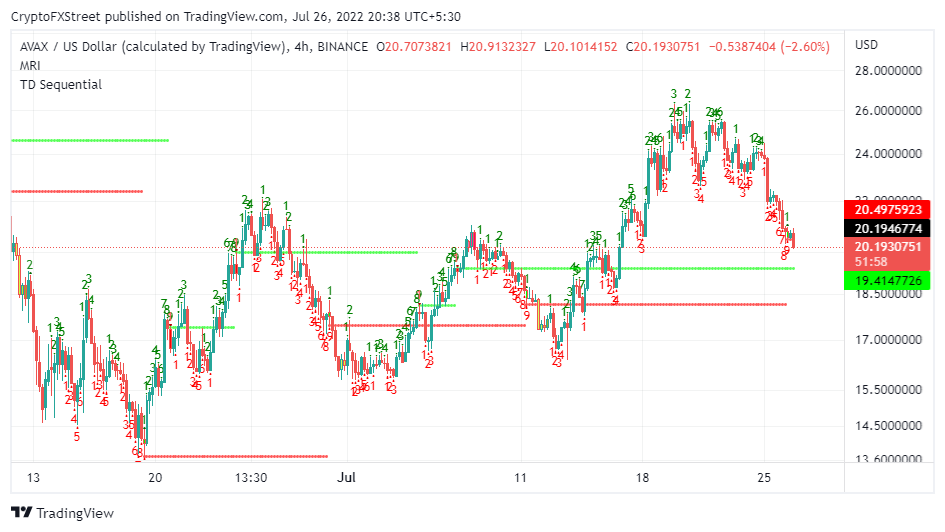
AVAX/USD four-hour chart
Traders are, however, advised to buy when the low of the sixth and seventh candles in the count are surpassed by the low of the eighth and ninth candles.
Author

John Isige
FXStreet
John Isige is a seasoned cryptocurrency journalist and markets analyst committed to delivering high-quality, actionable insights tailored to traders, investors, and crypto enthusiasts. He enjoys deep dives into emerging Web3 tren


