VeChain Price Analysis: VET stuck in a no-trade zone as bulls fight for breakout
- VET is trading within a ranging channel after a failed breakout.
- The MACD is leveling above the zero line, hinting at a minor bullish impulse.
- VeChain may drop toward $0.04 if the 50 SMA support fails to hold.

VeChain is trading at $0.052 after suffering a rejection under $0.06. The token is within a choppy market, implying that consolidation will continue to take precedence.
VeChain bulls fight to take control
VeChain is currently holding at a ranging parallel channel's middle boundary. This support must remain intact to ensure that bulls stay in control. Nevertheless, a leg down to the lower edge of the channel may attract more buyers to the market, thereby reviving the bullish outlook.
Besides the channel's support, the 50 Simple Moving Average provides support, likely to be strong enough to prevent losses from falling significantly below $0.05.
The sideways trading is validated by a directionless Moving Average Convergence Divergence (MACD). This is a technical indicator that tracks the asset's trend direction while measuring its momentum. For now, the MACD line (blue) has intertwined with the signal line, cementing the sideways trading action.
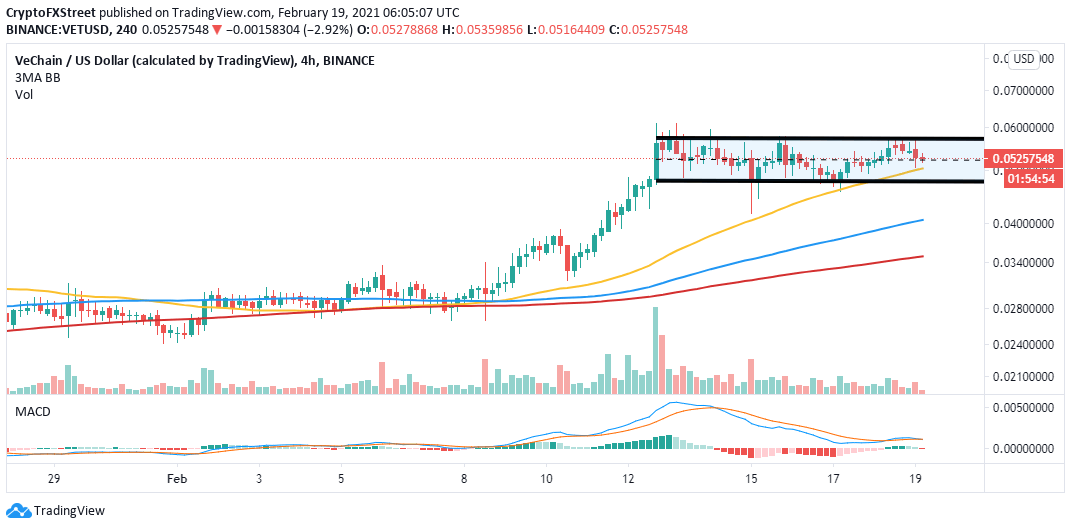
VET/USD 4-hour chart
The 4-hour Bollinger Bands confirm the sideways trading. If the bands continue to squeeze, it will signal that a breakout is around the corner. Holding above the middle boundary layer ensures that the bulls remain in control. On the upside, a break above $0.06 will call more buyers into the market, jumpstarting the trend toward $0.1.
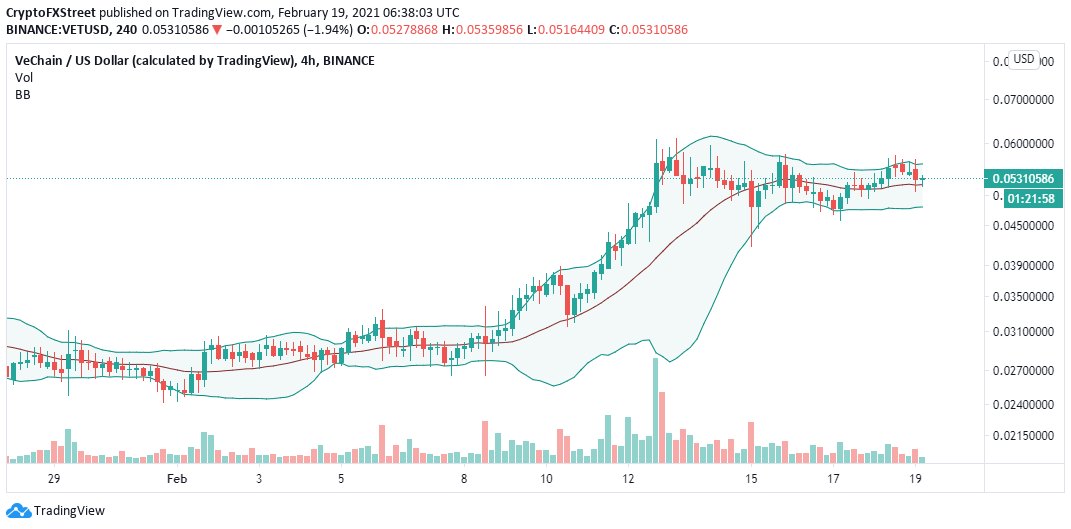
VET/USD 4-hour chart
Looking at the other side of the fence
VeChain is not out of the woods yet and could explore downhill levels, mostly if the Bollinger Bands' middle boundary support is shattered. While the 50 SMA is in line to provide anchorage, massive selling orders may be triggered if buyers are dispersed. Other vital levels to keep in mind are $0.045 and $0.04.
Author

John Isige
FXStreet
John Isige is a seasoned cryptocurrency journalist and markets analyst committed to delivering high-quality, actionable insights tailored to traders, investors, and crypto enthusiasts. He enjoys deep dives into emerging Web3 tren


