Uniswap Price Prediction: UNI eyes comeback to new record highs on breaking crucial resistance
- Uniswap eyes new all-time highs towards $30, but first, it must break above the 50 SMA.
- UNI has been pushed to the fifth position in DeFi as Aave rises to the second spot.
- The IOMAP model reveals that failure to break above $20 will lead to consolidation above $18.

Uniswap has recently retreated from its record high established at $22.5. The correction was, however, not elongated because support at $17 came in handy. UNI has also made a minor recovery but is yet to overcome the hurdle at $20. A massive breakout is expected when Uniswap settles above this level.
Uniswap drops to the 5th spot in DeFi
The decentralized finance (DeFi) sector has been a favorite for many in the cryptocurrency industry. It allows investors to earn interest in the tokens they lock within projects. The funds locked provide liquidity for those seeking loans.
Uniswap currently sits in the 5th position in DeFi as far as value locked in concerned. On the other hand, Aave receives incredible support from investors, hence the rise to the second position.
Uniswap has $3.78 billion locked in the project. Maker leads the DeFi locked values at $6.1 billion, followed by Aave at $5.57 billion. Compound boasts $4.3 billion and sits in the third position, followed closely by Curve Finance at $3.9 billion.
-637484449251004721.png)
Top ten DeFi projects
Uniswap must rise beyond $20 to sustain the uptrend
UNI is exchanging hands at $19.1 while the bulls fight to break the immediate seller congestion zone at the 50 Simple Moving Average on the 4-hour chart. Trading past this level will see Uniswap catapulted above $20, a move that could trigger massive buy orders.
The same 4-hour chart highlights the Moving Average Convergence Divergence (MACD) leveling slightly beneath the midline. Buyers need to look out for the MACD line (blue) crossing above the signal line, as it will signal a buy position.
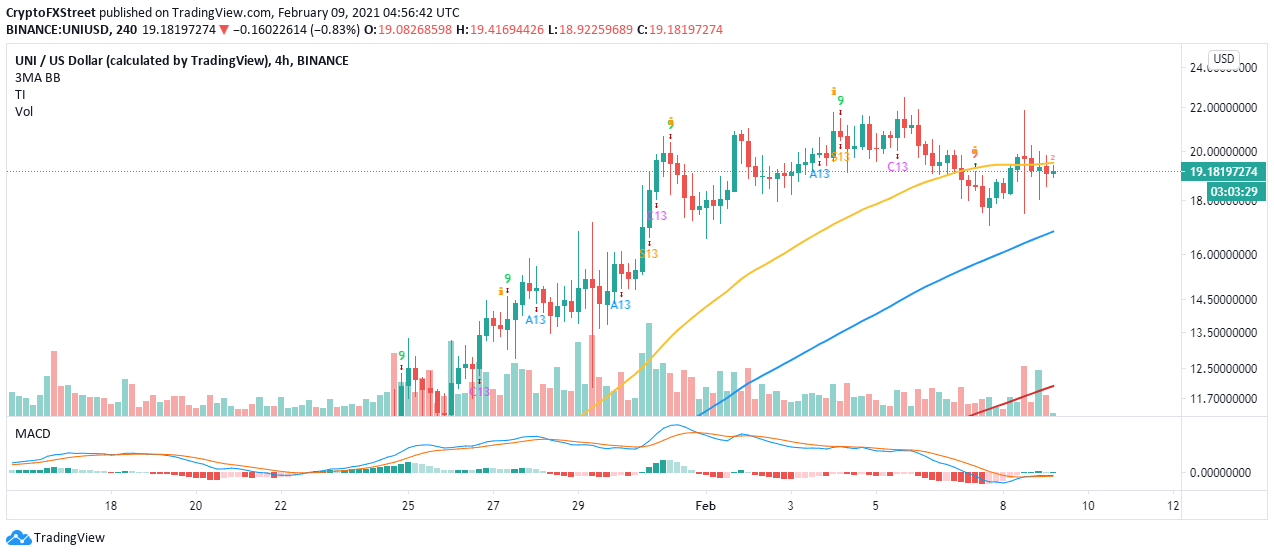
UNI/USD 4-hour chart
Two days ago TD Sequential indicator also presented a buy signal on the same 4-hour chart. The call to buy formed in a red nine candlestick. Uniswap moved up but failed to settle above $20. Therefore, an upswing above this same level could elevate the DeFi token to new all-time highs toward $30.
Looking at the other side of the fence
The bullish outlook may fail to materialize if the resistance presented by IntoTheBlock’s IOMAP chart remains intact. A critical seller congestion zone lies between $19.6 and $20, where nearly 2,400 addresses had previously bought roughly 10.6 million UNI.
-637484449042074038.png)
Uniswap IOMAO model
On the flip side, Uniswap is also trading above an area with immense support. This robust support zone runs from $17.4 to $18, whereby 179 addresses had previously purchased approximately 10.6 UNI.
In other words, if Uniswap fails to break above $20 to trigger more buy orders, it will continue to consolidate between the IOMAP support and resistance.
Author

John Isige
FXStreet
John Isige is a seasoned cryptocurrency journalist and markets analyst committed to delivering high-quality, actionable insights tailored to traders, investors, and crypto enthusiasts. He enjoys deep dives into emerging Web3 tren




