Uniswap Price Forecast: UNI ready to dump 24% despite closing in on the all-time high at $8.75
- Uniswap breaks down under an ascending parallel channel following a rejection at $7.
- A reduction in network growth is a crucial bearish signal for the token and the network's adoption.

Uniswap continues to be one of the best-performing decentralized finance (DeFi) tokens in the market. Over the last three months, UNI has recovered by nearly 300% from $1.75 to a new 2021 high of $6.9. However, a reversal seems imminent at the time of writing and is likely to extend to $4.5.
Uniswap rejected from $7 as technicals turn bearish
The flagship cryptocurrency hit $40,000 on Thursday for the first time in history. The entire cryptocurrency market shot upwards in tandem with BTC. Uniswap made a final leap towards its all-time high at $8.75 but stalled short of $7.
At the time of writing, UNI/USD is teetering at $5.58 after the rejection that has proved significant enough to shatter support expected at the ascending parallel channel's lower boundary. For now, all eyes are on the 50 Simple Moving Average on the 4-hour chart to provide the much-needed support.
However, if push comes to shove, Uniswap is poised for an extended downfall towards the 100 SMA. The Relative Strength Index reinforces the breakdown as it spirals quickly to the oversold region.
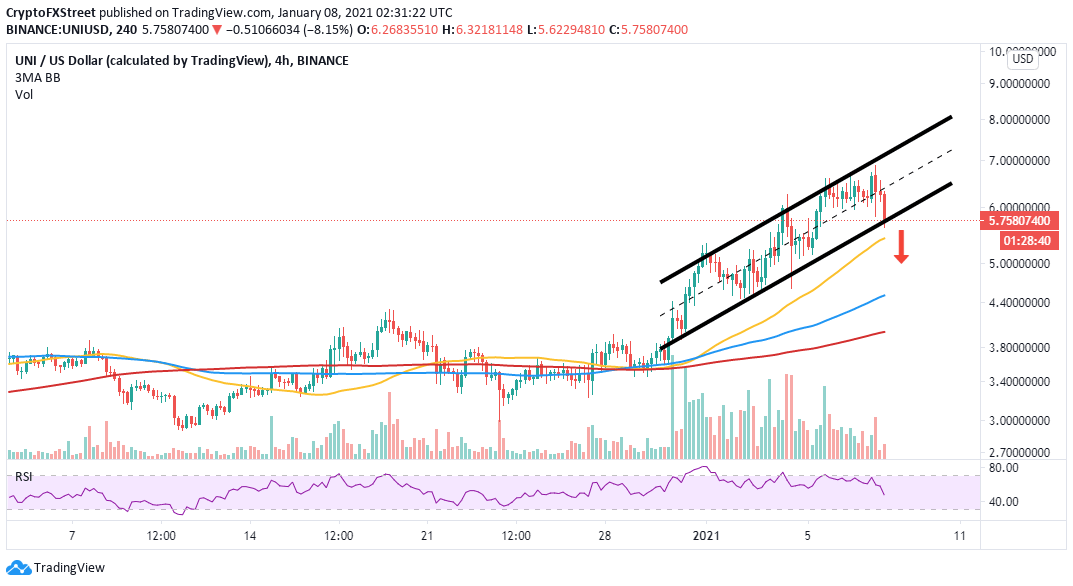
UNI/USD 4-hour chart
The TD Sequential indicator has recently presented a sell signal on the 123-hour chart. The bearish outlook manifested in a green nine candlestick. Its validation saw massive sell orders triggered and may continue printing one to four bearish candlesticks on the day.
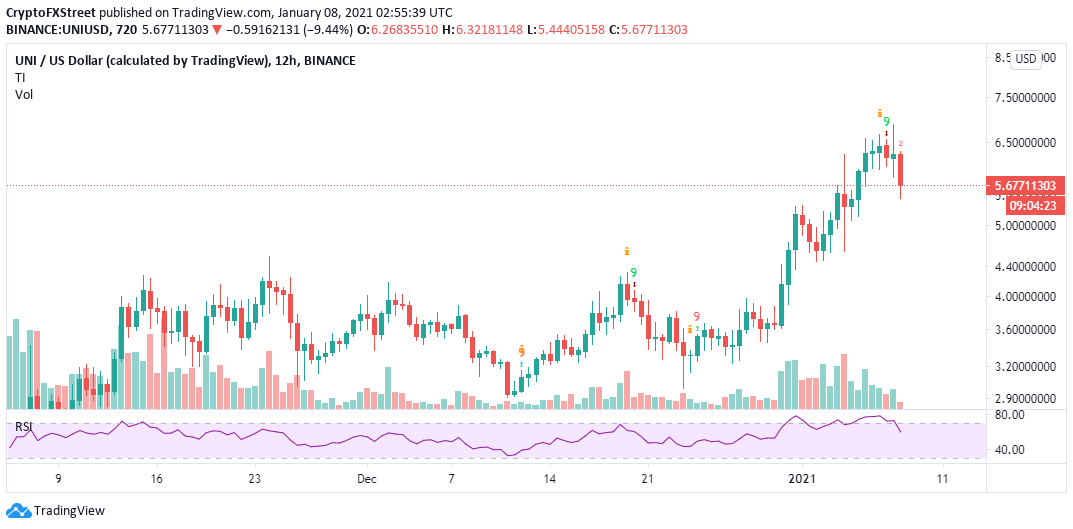
UNI/USD 12-hour chart
According to the "Daily Active Addresses" model by IntoTheBlock, new addresses joining the DeFi network have taken a turn to the south. This could explain the overhead pressure on UNI at the time of writing.
-637456725366360836.png)
Uniswap new addresses chart
A negative network growth is usually a critical bearish signal for the token's price and the project's future. The number of new addresses that have joined the network in the last 24 hours stands at approximately 1,800 compared to 2,300 on December 31.
It is worth mentioning that the pessimistic outlook will be invalidated if the 100 SMA support remains intact. Buyers are likely to take advantage of the stability at this level to join the market in anticipation of new all-time highs.
Author

John Isige
FXStreet
John Isige is a seasoned cryptocurrency journalist and markets analyst committed to delivering high-quality, actionable insights tailored to traders, investors, and crypto enthusiasts. He enjoys deep dives into emerging Web3 tren



![Zcash breaks above 2018 highs, eyes 1600–2500 [Video]](https://editorial.fxsstatic.com/images/i/crypto-coins-1.png)