Uniswap Price Analysis: UNI’s on-chain metrics define two key levels projecting a 30% move
- Uniswap price is contained inside a descending parallel channel on the 4-hour chart.
- The digital asset is in a no-trade zone until a clear breakout or breakdown happens.

Uniswap has been trading sideways for the past two months between two key levels that define a descending parallel channel on the 4-hour chart. The digital asset awaits a clear breakout or breakdown.
Uniswap price could see a 30% move if this key level breaks
On the 4-hour chart, Uniswap has established a descending parallel channel which seems to favor the bulls as the current Uniswap price is $3.78, which is close to the upper trendline resistance of $4.
-637449475976769598.png)
UNI/USD 4-hour chart
A breakout above $4 can quickly drive Uniswap price towards $5.5. The In/Out of the Money Around Price (IOMAP) chart seems to give credence to this bullish outlook as it shows the most significant resistance area to be located between $3.89 and $4, but very little resistance above.
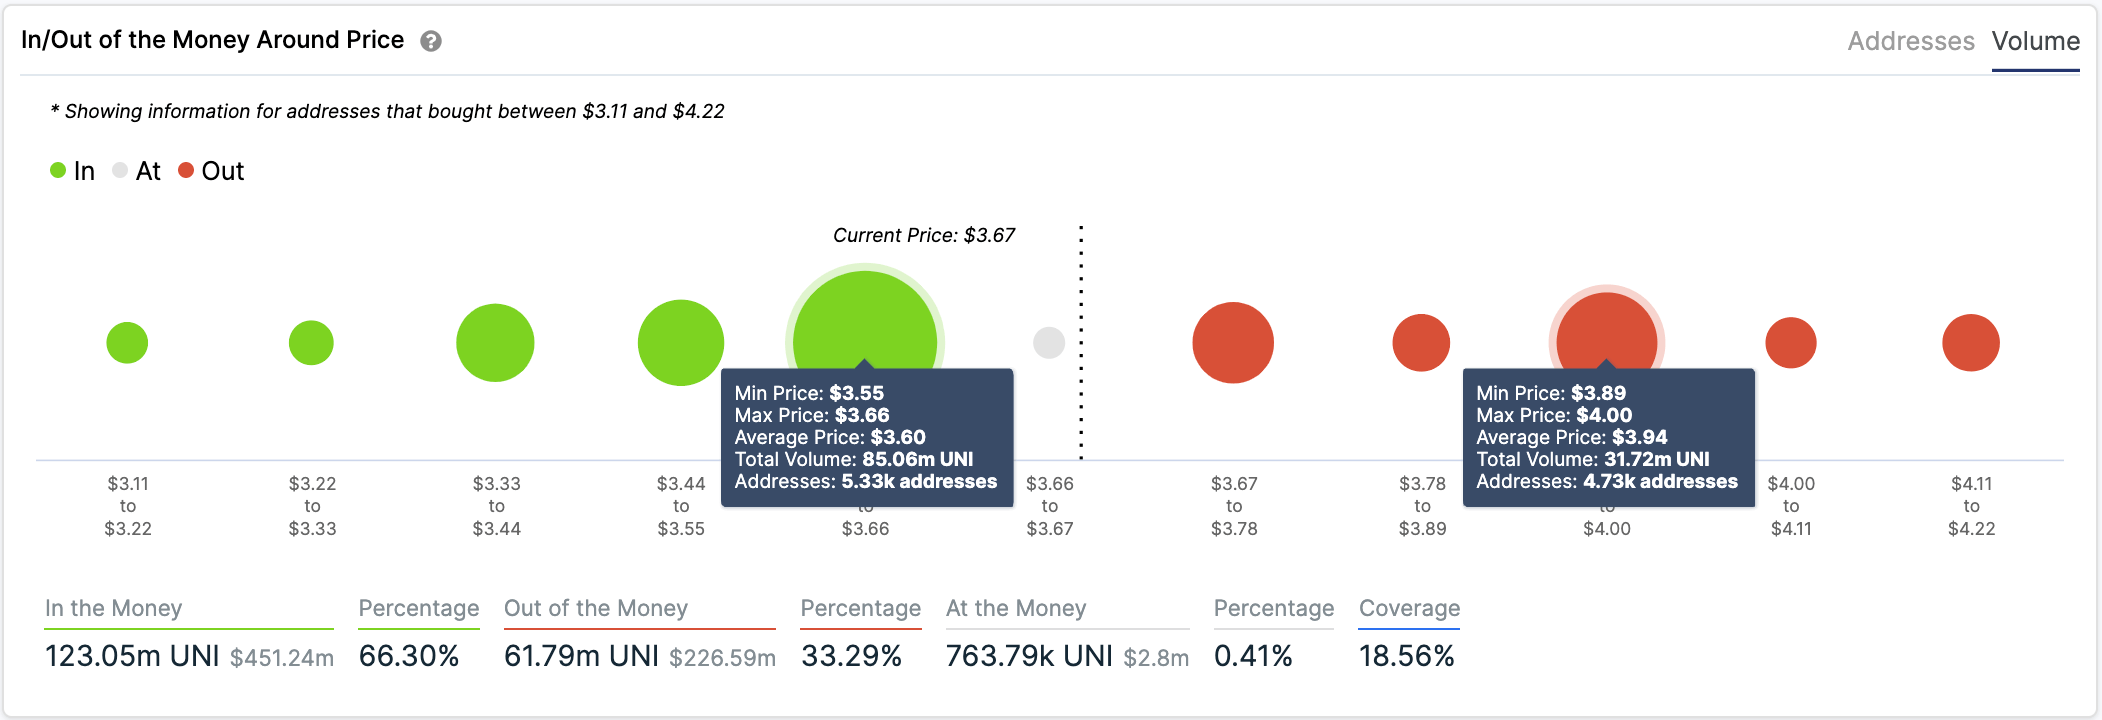
UNI IOMAP chart
However, the IOMAP chart also shows only one crucial support level at $3.6. A breakdown below this point would push Uniswap price down to the lower boundary of the descending parallel channel at $2.5.
Author

Lorenzo Stroe
Independent Analyst
Lorenzo is an experienced Technical Analyst and Content Writer who has been working in the cryptocurrency industry since 2012. He also has a passion for trading.


