UMA price primed for another 30% rise if this key resistance level is broken
- UMA price had a massive 300% rally in the past week, reaching a high of $43.99.
- The digital asset has been under consolidation and it’s ready for another leg up.
- Bulls face only one crucial barrier that, if broken, can quickly drive UMA towards $37.

UMA had a massive rally from February 1 to February 4, reaching a high of $43.99 after a 310% run. Since then, the digital asset had a healthy consolidation down to $25 and seems ready to resume the uptrend.
UMA price trades at a critical point
UMA has established a descending triangle pattern on the 4-hour chart, with a critical resistance level at around $30. A breakout above this point would push UMA price up to $37 in the short-term.
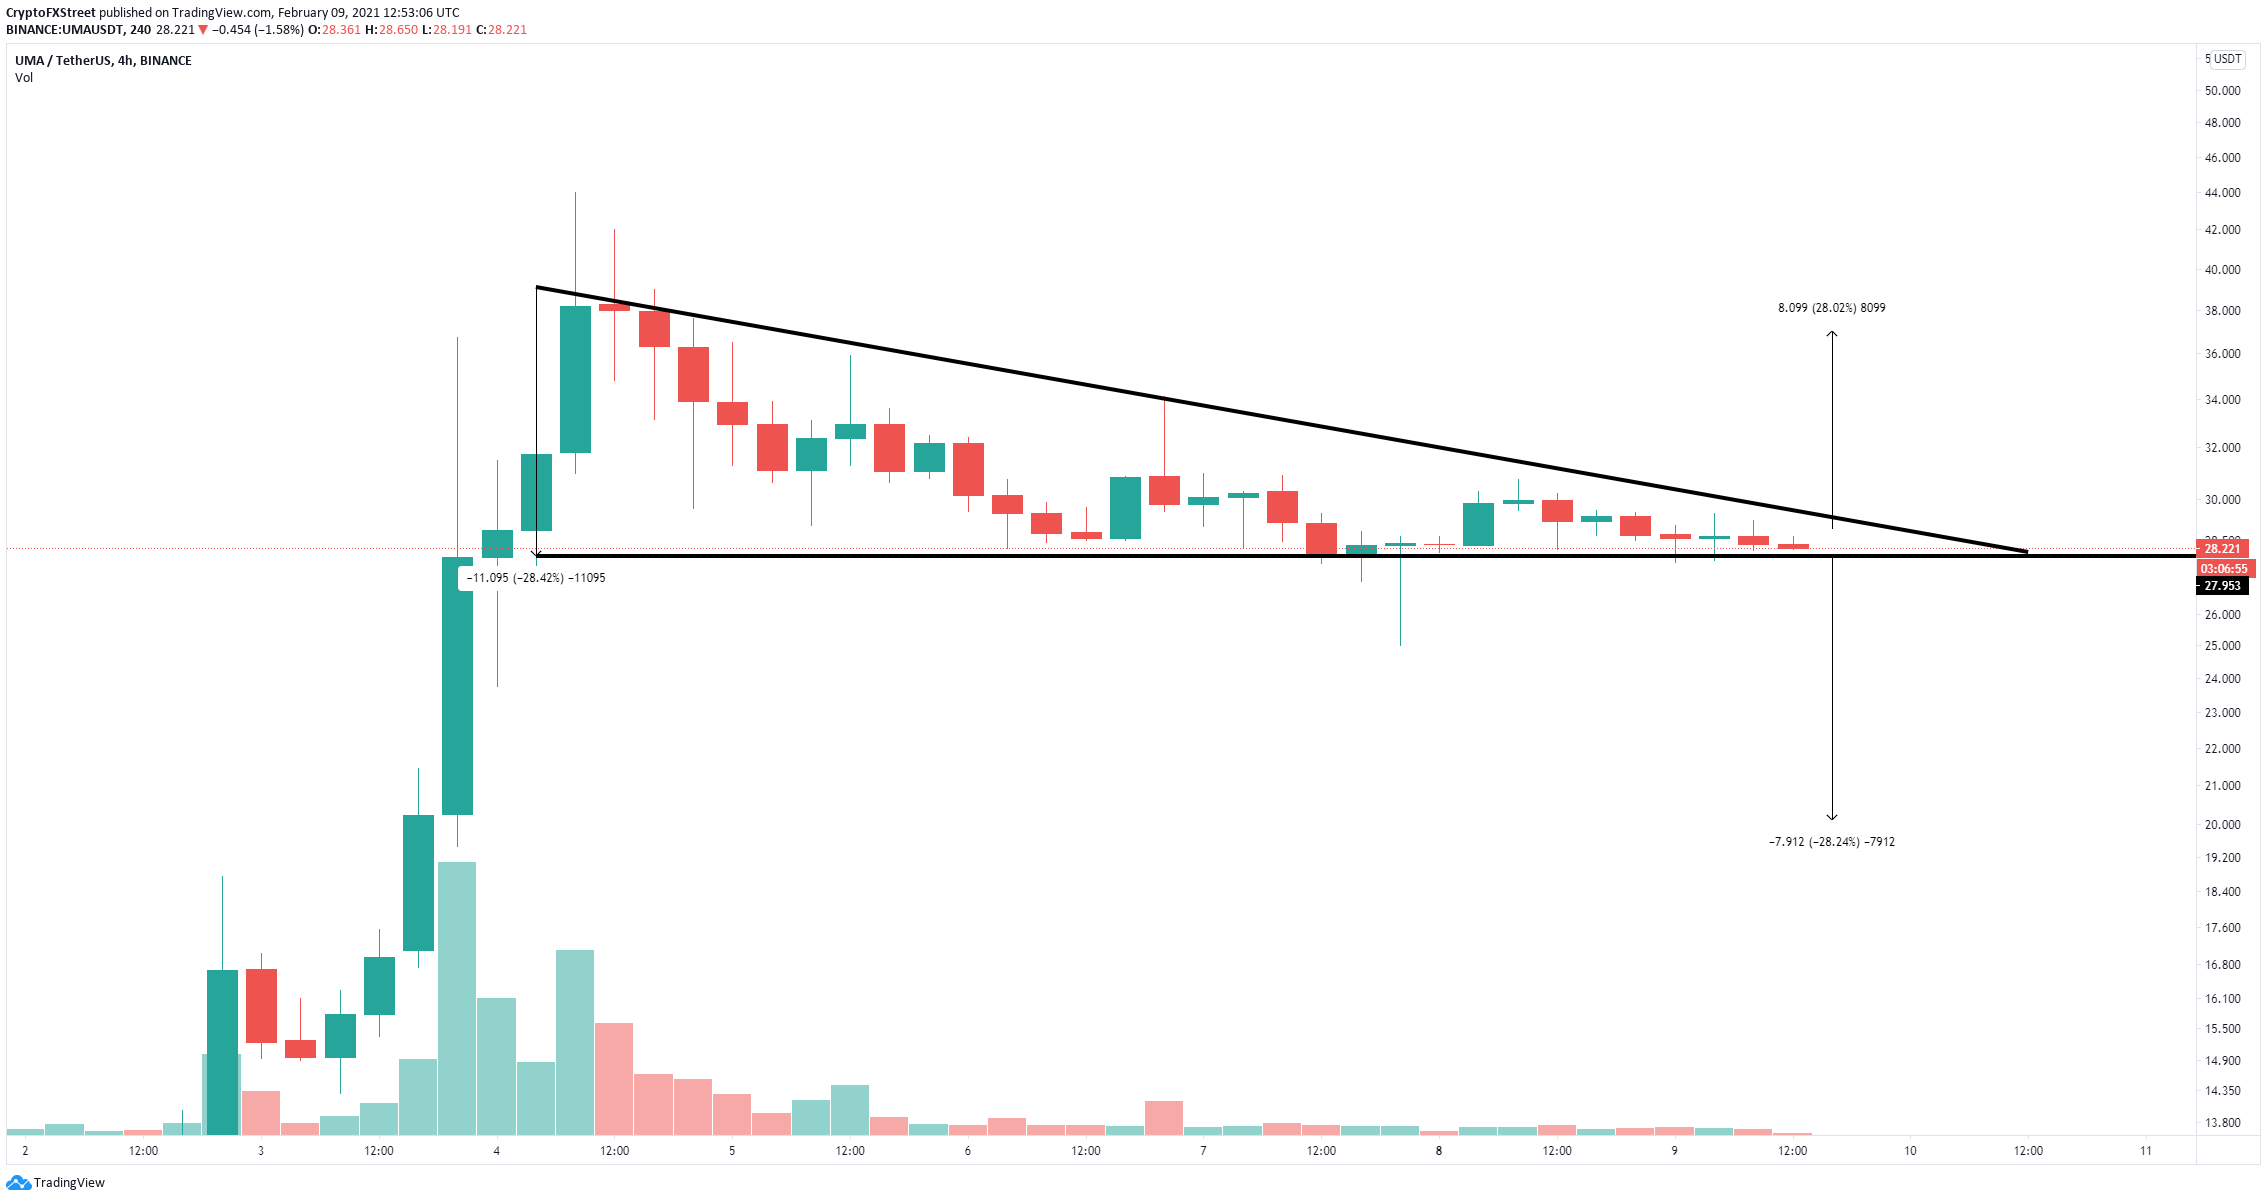
UMA/USD 4-hour chart
The In/Out of the Money Around Price (IOMAP) chart shows a similar story, with a huge resistance area between $28 and $30. More than 9 million UMA in volume makes this range a significant barrier for the bulls. However, there is very weak resistance above this point, which adds credence to the bullish outlook.
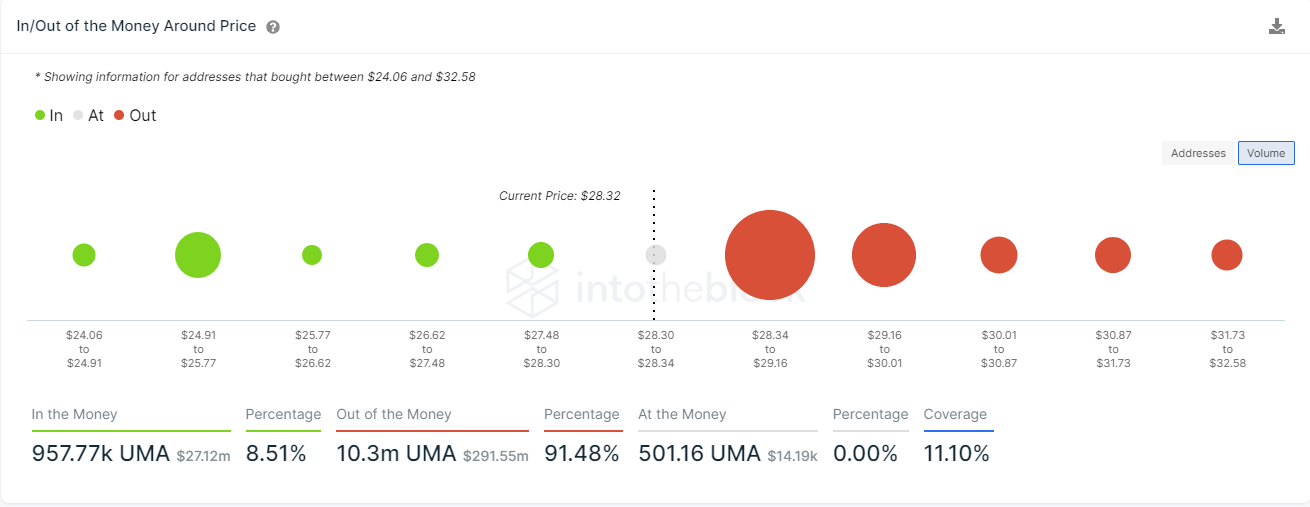
UMA IOMAP
Additionally, the number of whales holding between 100,000 and 1,000,000 UMA coins ($2,800,000 and $28,000,000) has increased by nine since January 11, which indicates large investors believe UMA price can rise even higher.
%20[14.00.50,%2009%20Feb,%202021]-637484727409593678.png)
UMA Holders Distribution chart
However, the IOMAP model also indicates weak support below $28 and the descending triangle pattern on the 4-hour chart has its support trendline established at that level. A breakdown below this point can drive UMA price down to $20.
Author

Lorenzo Stroe
Independent Analyst
Lorenzo is an experienced Technical Analyst and Content Writer who has been working in the cryptocurrency industry since 2012. He also has a passion for trading.


