UMA price on the brink of a significant correction down to $25 if this level cracks
- UMA price had a massive 300% breakout in the past week hitting $43.99.
- The digital asset has been under consolidation since then but could see a stronger pullback.
- Many on-chain metrics remain in favor of UMA over the long-term.

UMA had an explosive breakout on February 2 jumping from a low of $11.23 to a high of $18.74 within 24 hours. Three days later, the digital asset hit an all-time high price of $43.99 and it’s currently trading at $29.74 after a brief pullback.
UMA price could see a stronger correction according to several indicators
Although UMA price has already experienced a notable correction, the digital asset might be poised for more. On the daily chart, the TD Sequential indicator presented a sell signal on February 7.
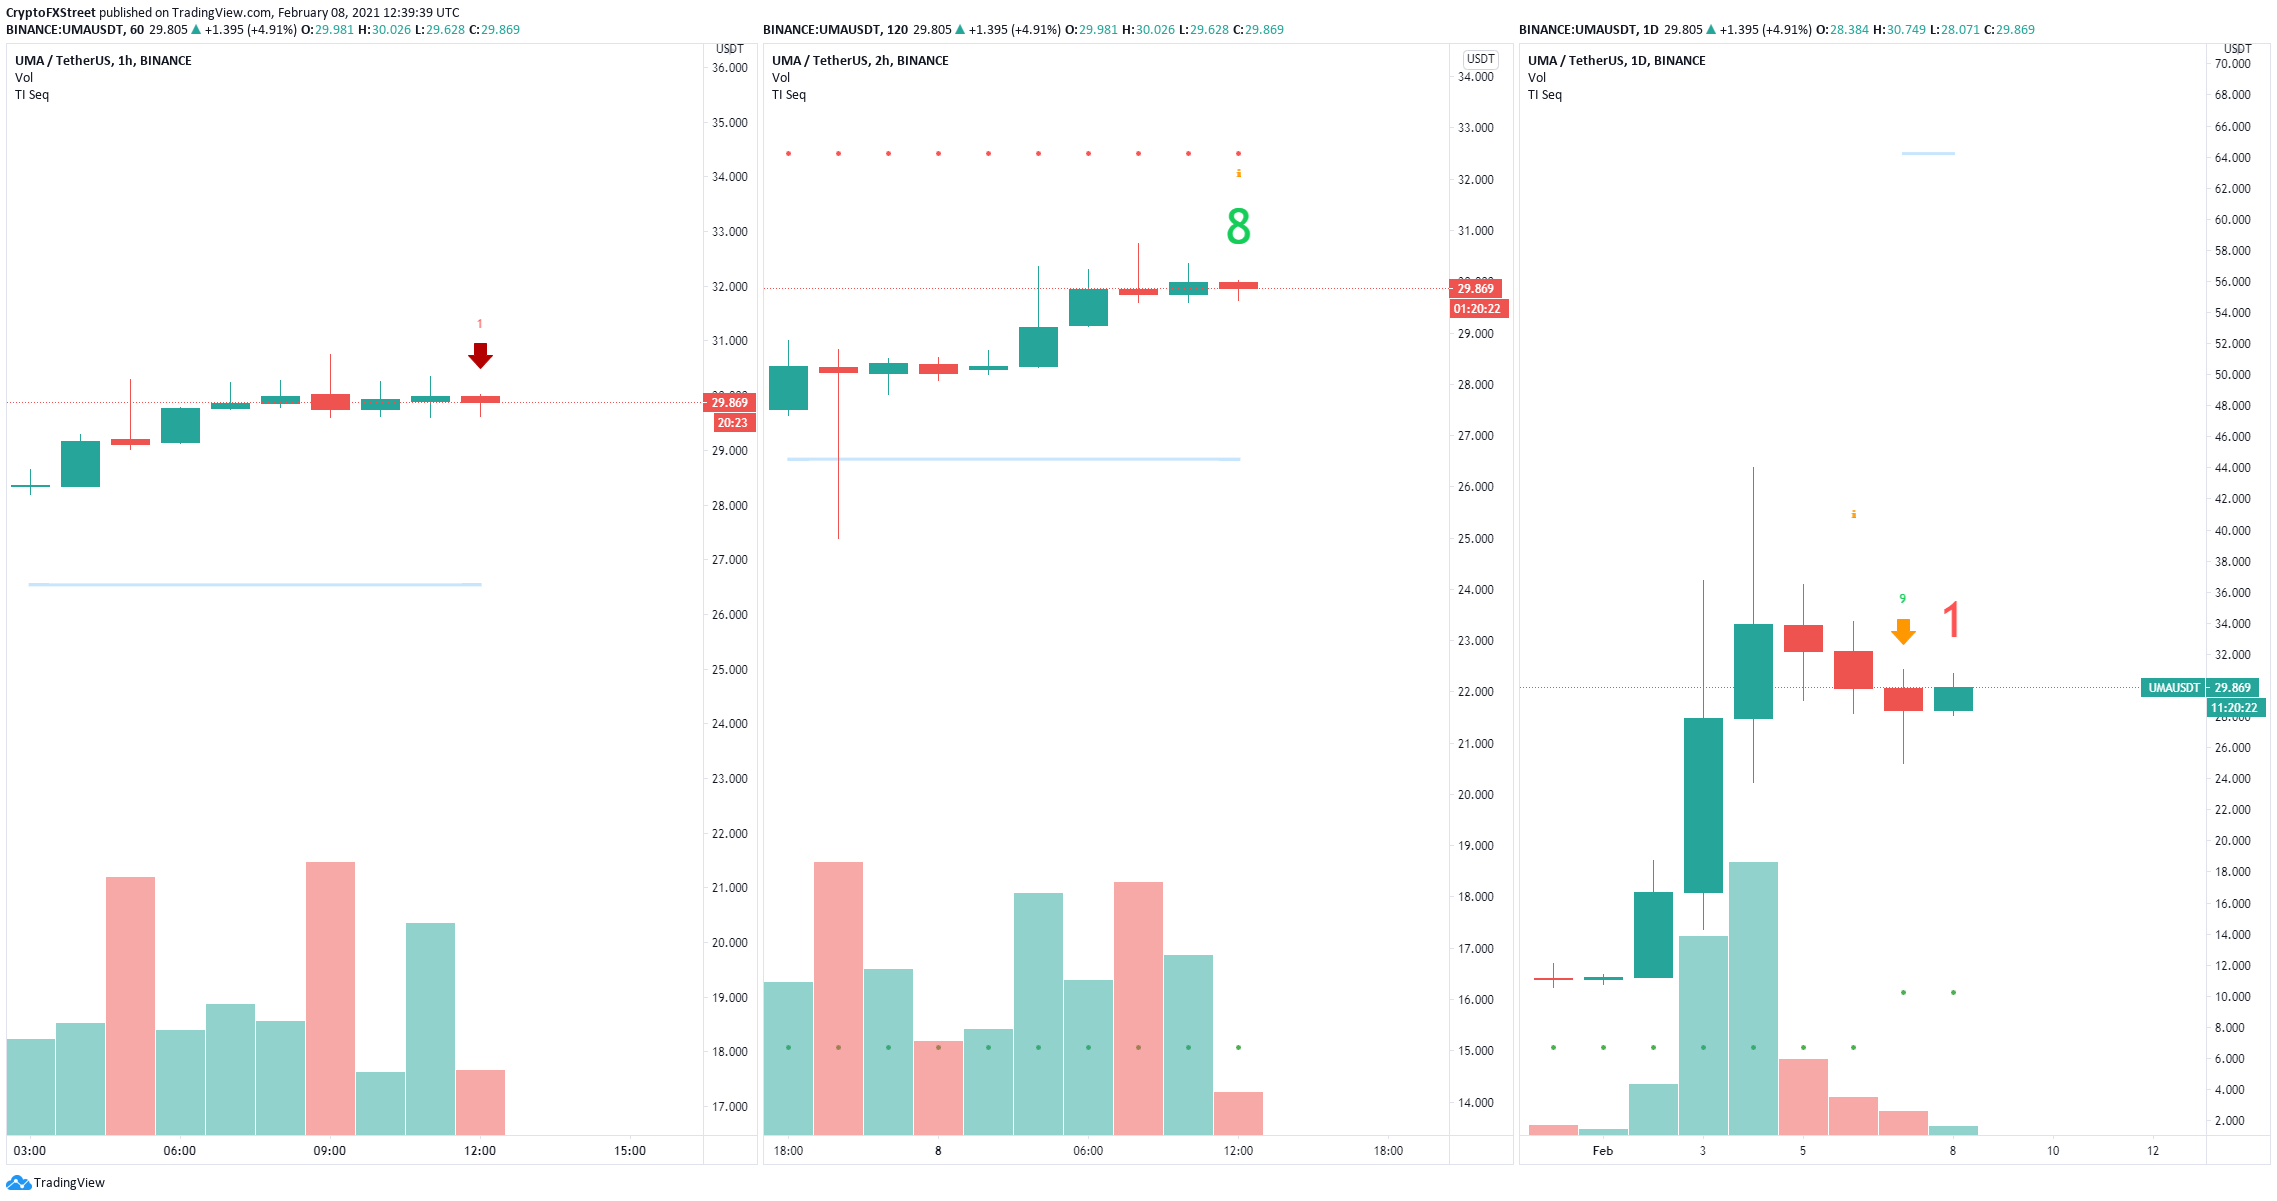
UMA Sell Signals
Additionally, on the 1-hour chart, the indicator presented another sell signal and it’s on the verge of doing the same on the 2-hour chart which means that UMA’s short-term outlook is also bearish.
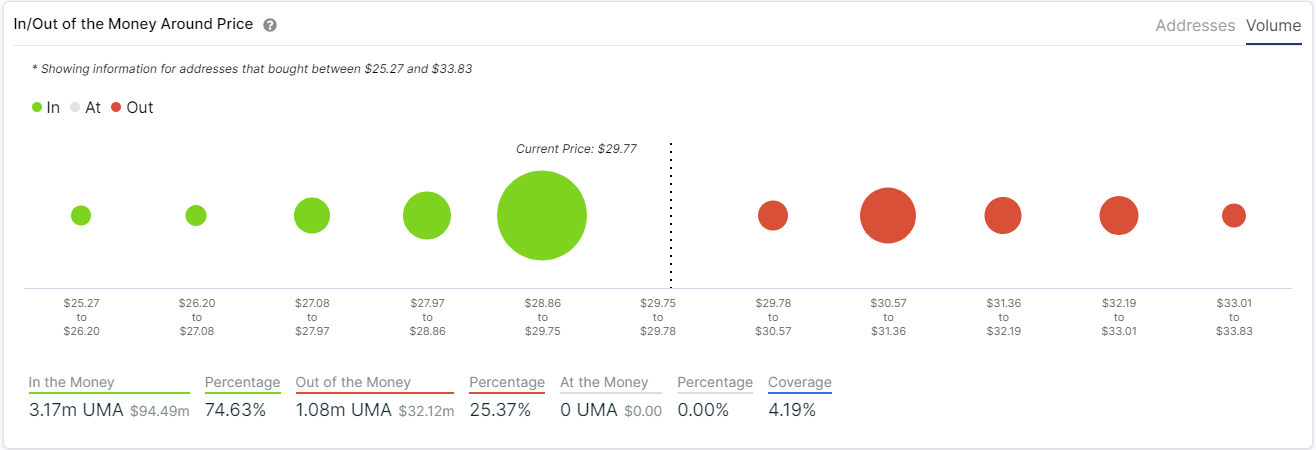
UMA IOMAP
The In/Out of the Money Around Price (IOMAP) chart shows that UMA has only one robust support area between $28.86 and $29.75 with 2.63 million UMA in volume. Losing this level can quickly push UMA price down to $25 as there are no other significant support levels below.
%20[13.43.16,%2008%20Feb,%202021]-637483851436934806.png)
UMA Holders Distribution chart
However, since December 20, 2020, the number of whales joining the UMA network has exploded from a low of 39 to a current all-time high of 53. Each whale is holding between 100,000 and 1,000,000 coins ($3,000,000 and $30,000,000).
The IOMAP model indicates that the range between $30.5 and $31.3 is the strongest barrier for the bulls. Cracking this resistance area will drive UMA price towards $44 again.
Author

Lorenzo Stroe
Independent Analyst
Lorenzo is an experienced Technical Analyst and Content Writer who has been working in the cryptocurrency industry since 2012. He also has a passion for trading.


