Sui Price Forecast: SUI capitulates under pressure, opens the door to $0.70
- Sui is down nearly 3% so far on Tuesday, extending the downside breakout of a short-term range.
- Derivatives data shows heightened bearish interest among traders, favoring a buildup of short positions.
- The technical outlook for Sui remains bearish, implying a potential drop toward $0.70.

Sui (SUI) declines by 3% at press time on Tuesday, extending the downside breakout of a short-consolidation range confirmed the previous day. Retail sentiment is bearish, as evidenced by increased long liquidations and a sharp drop in the funding rate. The technical outlook indicates a possibility of a steeper correction to the $0.70 level.
Derivatives data flags bearish incline in SUI traders
The Grayscale Sui Staking Exchange-Traded Fund (ETF) launched last week, offering exposure to the Sui Network’s native token, has failed to boost retail demand for SUI. Derivatives market data shows a bearish bias among traders, aligning with the risk-averse broader market conditions.
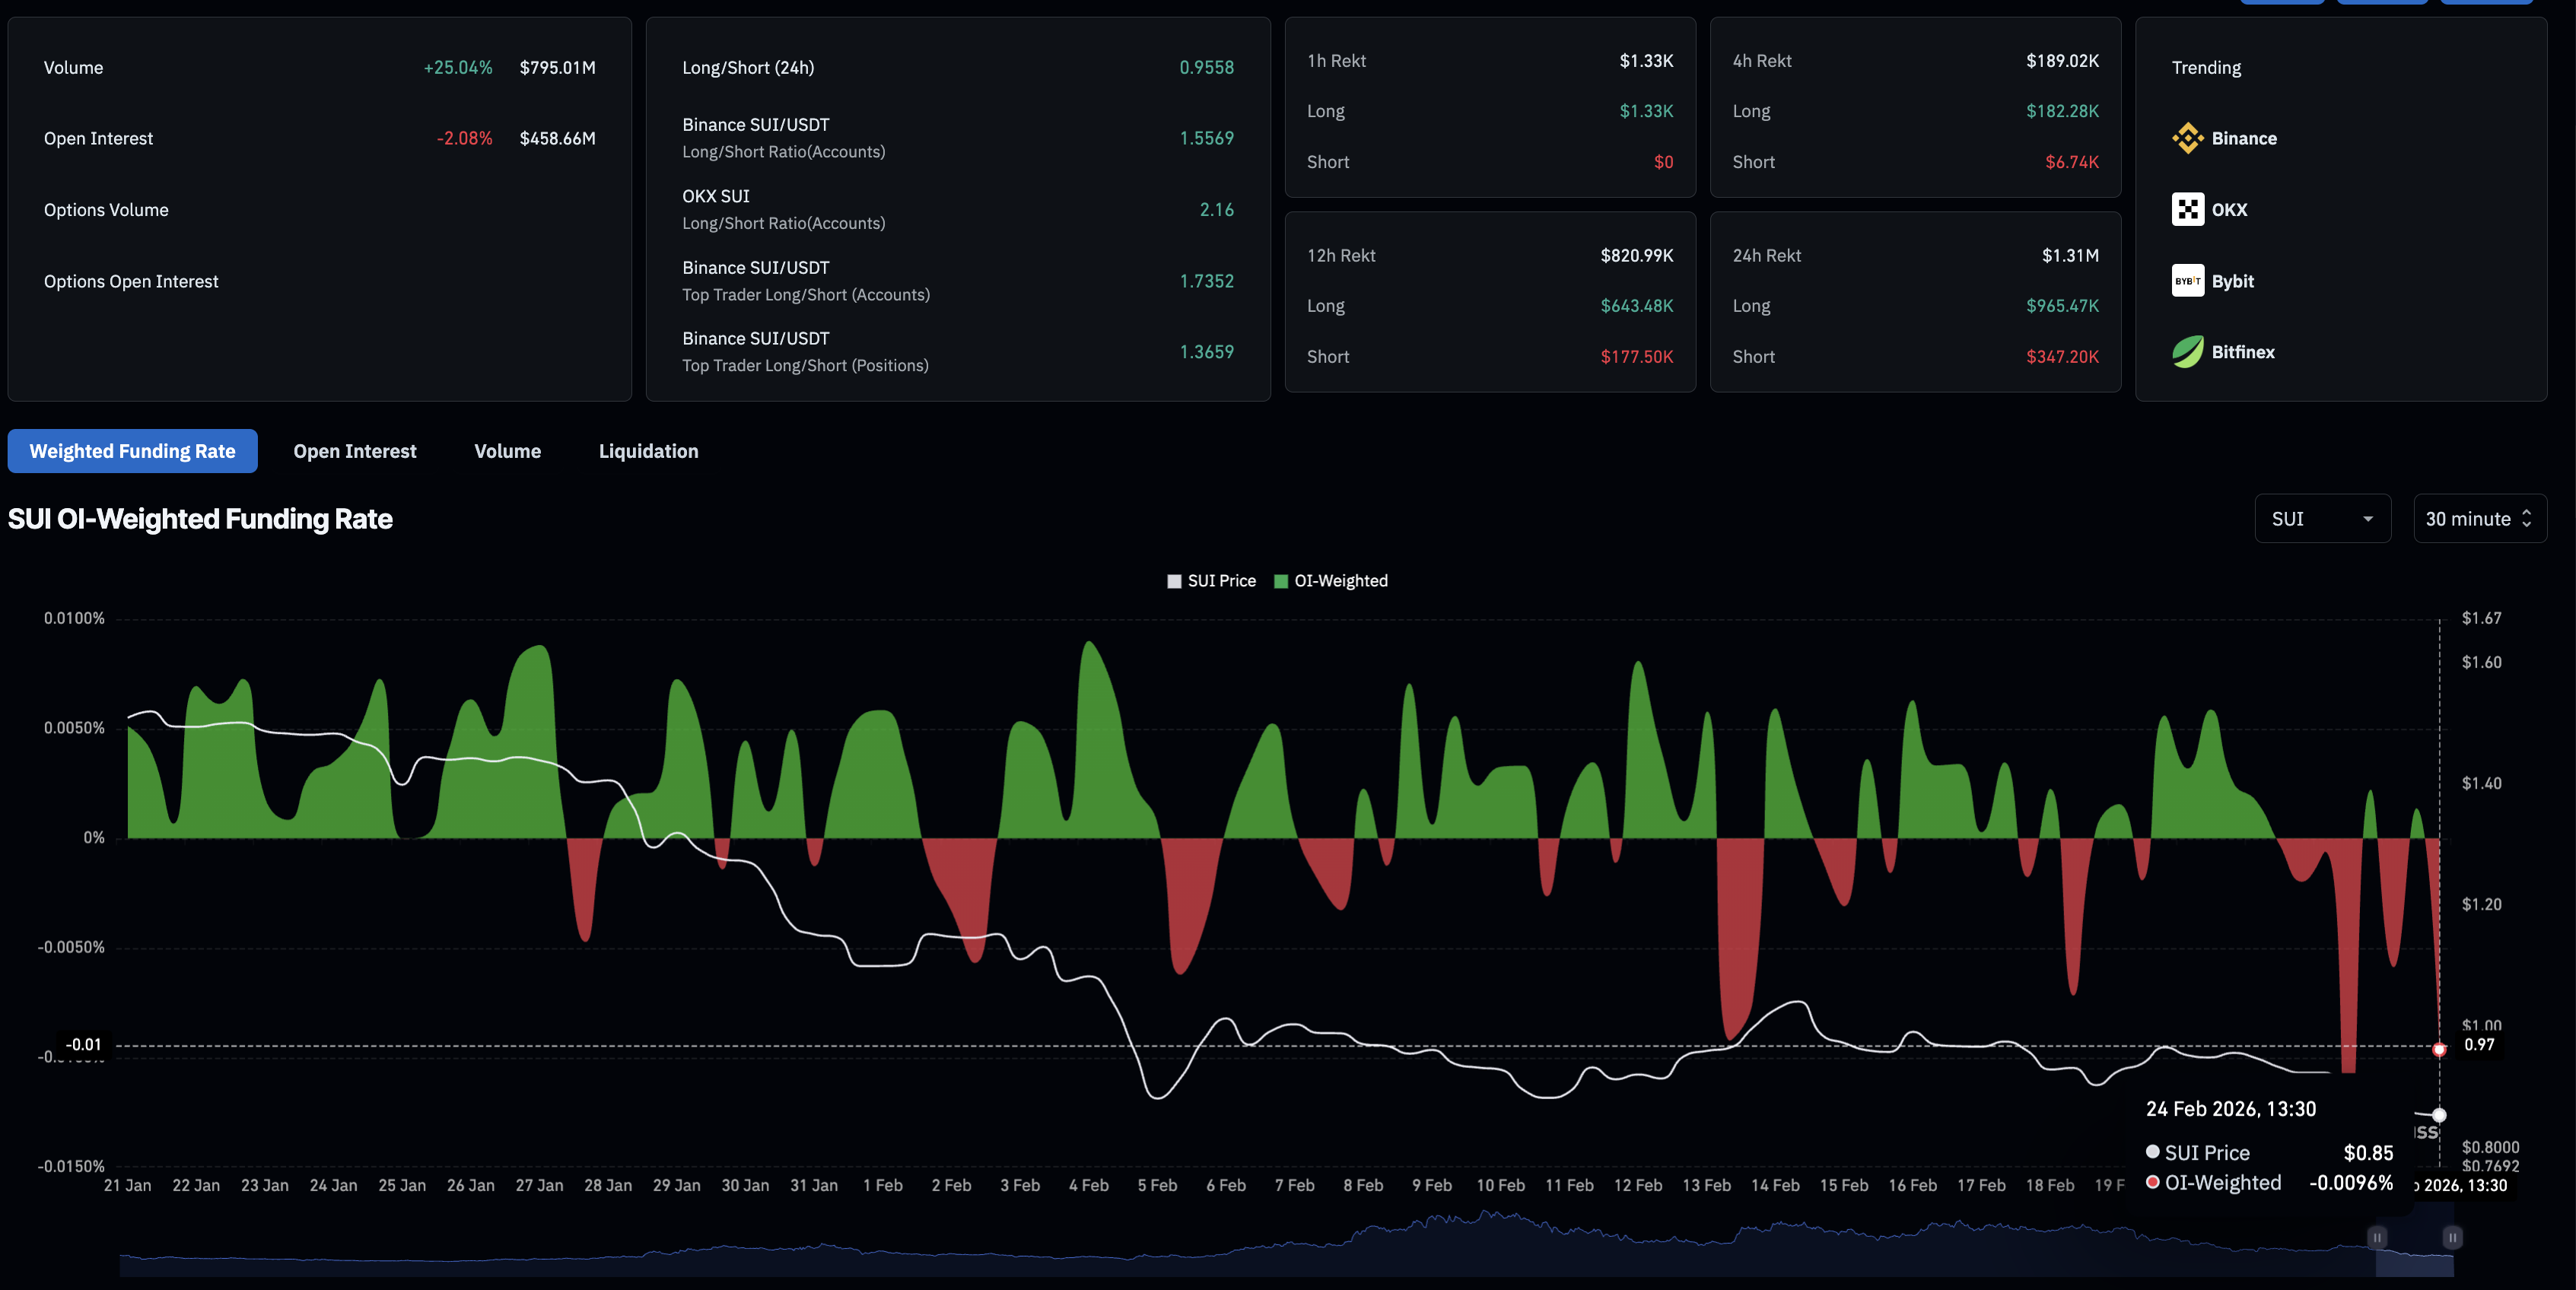
CoinGlass data shows that SUI Open Interest (OI) is at $458.66 million, down 2.08% over the last 24 hours, indicating a capital outflow from the derivatives market. This aligns with long liquidation of $965,470 in the same time period, outpacing short liquidations of $347,200.
Due to the long positions wipeout, the long-to-short ratio has dropped below 1, to 0.9558, indicating a greater number of active short positions. Additionally, the OI-weighted funding rate is down to -0.0096%, suggesting strong interest among traders for a short positional build-up.
Technical outlook: Will SUI price fall to $0.70?
SUI is down 3% at press time on Tuesday, extending its decline for the fourth consecutive day and trading below the $0.88 support level, aiming for a lower leg. The lowering slope of the 50-day and 200-day Exponential Moving Averages (EMAs) confirms the longer-term bearish bias.
The four-day decline in SUI breaks below the consolidation range between the 100% and 78.6% trend-based Fibonacci retracement levels at $0.88 and $1.05, respectively, measured from the October 13 high at $3.01 to the January 6 high at $2.02 with a lower extension at the November 21 low of $1.31.
The path of least resistance targets the 1.272 trend-based Fibonacci retracement level at $0.70, indicating a roughly 18% downside risk from the current price.
The technical indicators on the daily chart suggest that the short-term buying pressure is fading. The Relative Strength Index (RSI) at 31 fails to sustain rebounds from the oversold zone, suggesting persistent, though not extreme, bearish pressure. Meanwhile, the Moving Average Convergence Divergence (MACD) remains close to its signal line as the positive histogram contracts, indicating the risk of a bearish crossover. If confirmed, the indicator would flash a sell signal, suggesting renewed bearish momentum.
To reinstate a short-term recovery, SUI must resurface above $0.88 on a daily close, easing downside pressure and paving the way for a rebound to the $1.00 psychological level, followed by resistance at $1.05.
(The technical analysis of this story was written with the help of an AI tool.)
Author

Vishal Dixit
FXStreet
Vishal Dixit holds a B.Sc. in Chemistry from Wilson College but found his true calling in the world of crypto.



