TRON Technical Analysis: TRX breakdown targets $0.022
- TRON loses significant ground after hitting the barrier at the 100-day SMA.
- TRX/USD might retreat to $0.022 if the price closes the day below the 50-day SMA.

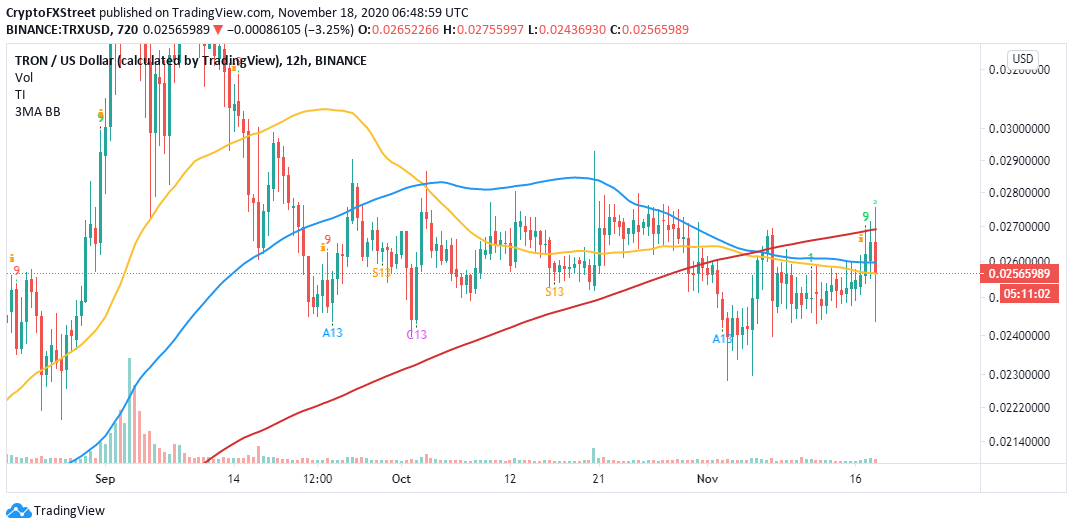
TRON retreated extensively from September’s peak of $0.05 before consolidation took over between $0.025 and $0.027. Despite the recovery that came into the picture at $0.0225, TRX appears to have resumed the downtrend targeting $0.022.
TRON is on the cusp of a breakdown
The smart contract token recently recovered from the dip where it stepped above $0.026. Nonetheless, the bullish momentum lost steam at the 100-day Simple Moving Average, leaving $0.027 untested. This recovery occurred amid the surge across the market and Bitcoin’s spike to levels above $18,000.
TRX/USD has been rejected by the 100 SMA and declines have even overshot the 50-day SMA. The token is trading at $0.0255 as the bearish grip becomes stronger. If the immediate support at $0.025 fails to hold, TRX will probably resume the downtrend towards $0.022.
 (19)-637412802989027573.png)
TRX/USD daily chart
The bearish outlook is validated by the Relative Strength Index (RSI) as it dives under the midline. Moreover, the TD Sequential indicator recently presented a sell signal in the form of a green nine candlestick. If sell orders soar, which could be triggered by the price sliding below the 100 SMA on the 12-hour chart, TRON may spiral to the tentative buyer concentration area at $0.022.
TRX/USD 12-hour chart
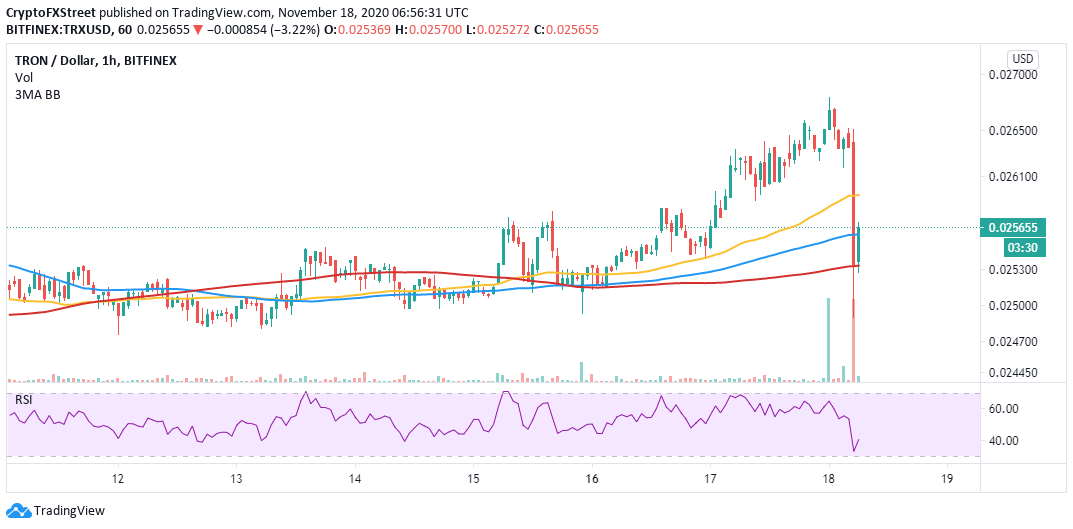
The bearish scenario eyeing $0.022 will be invalidated if TRON holds above the 200 SMA on the hourly chart. On the upside, closing above the 50 SMA might cultivate confidence in the bullish camp, leading to an increase in buy orders and eventually a spike to the 100 SMA, at $0.026.
TRX/USD 1-hour chart
Short term analysis using the RSI shows that buying pressure is not absent in the market. In other words, the reversal of the RSI after touching the oversold region illustrates a bullish momentum that is starting to grow.
Author

John Isige
FXStreet
John Isige is a seasoned cryptocurrency journalist and markets analyst committed to delivering high-quality, actionable insights tailored to traders, investors, and crypto enthusiasts. He enjoys deep dives into emerging Web3 tren



