Zcash Price Forecast: ZEC posts double-digit gains despite a weak derivatives market
- Zcash rises by more than 18%, reflecting a collective return of the bulls, following sharp volatility.
- ZEC’s rebound lacks retail support, as futures Open Interest drops to $335 million.
- Zcash bulls depend on short-term support around $230 to sustain the ongoing recovery.

Zcash (ZEC) extends recovery above $240 at the time of writing on Friday, as the broader crypto market sees relief rallies after this week’s turbulence. The privacy-oriented token is up over 31% from its intraday low at $185. Despite the increase, traders should remain cautious amid persistent weakness in the derivatives market.
Zcash rally at risk of slowing amid muted retail activity
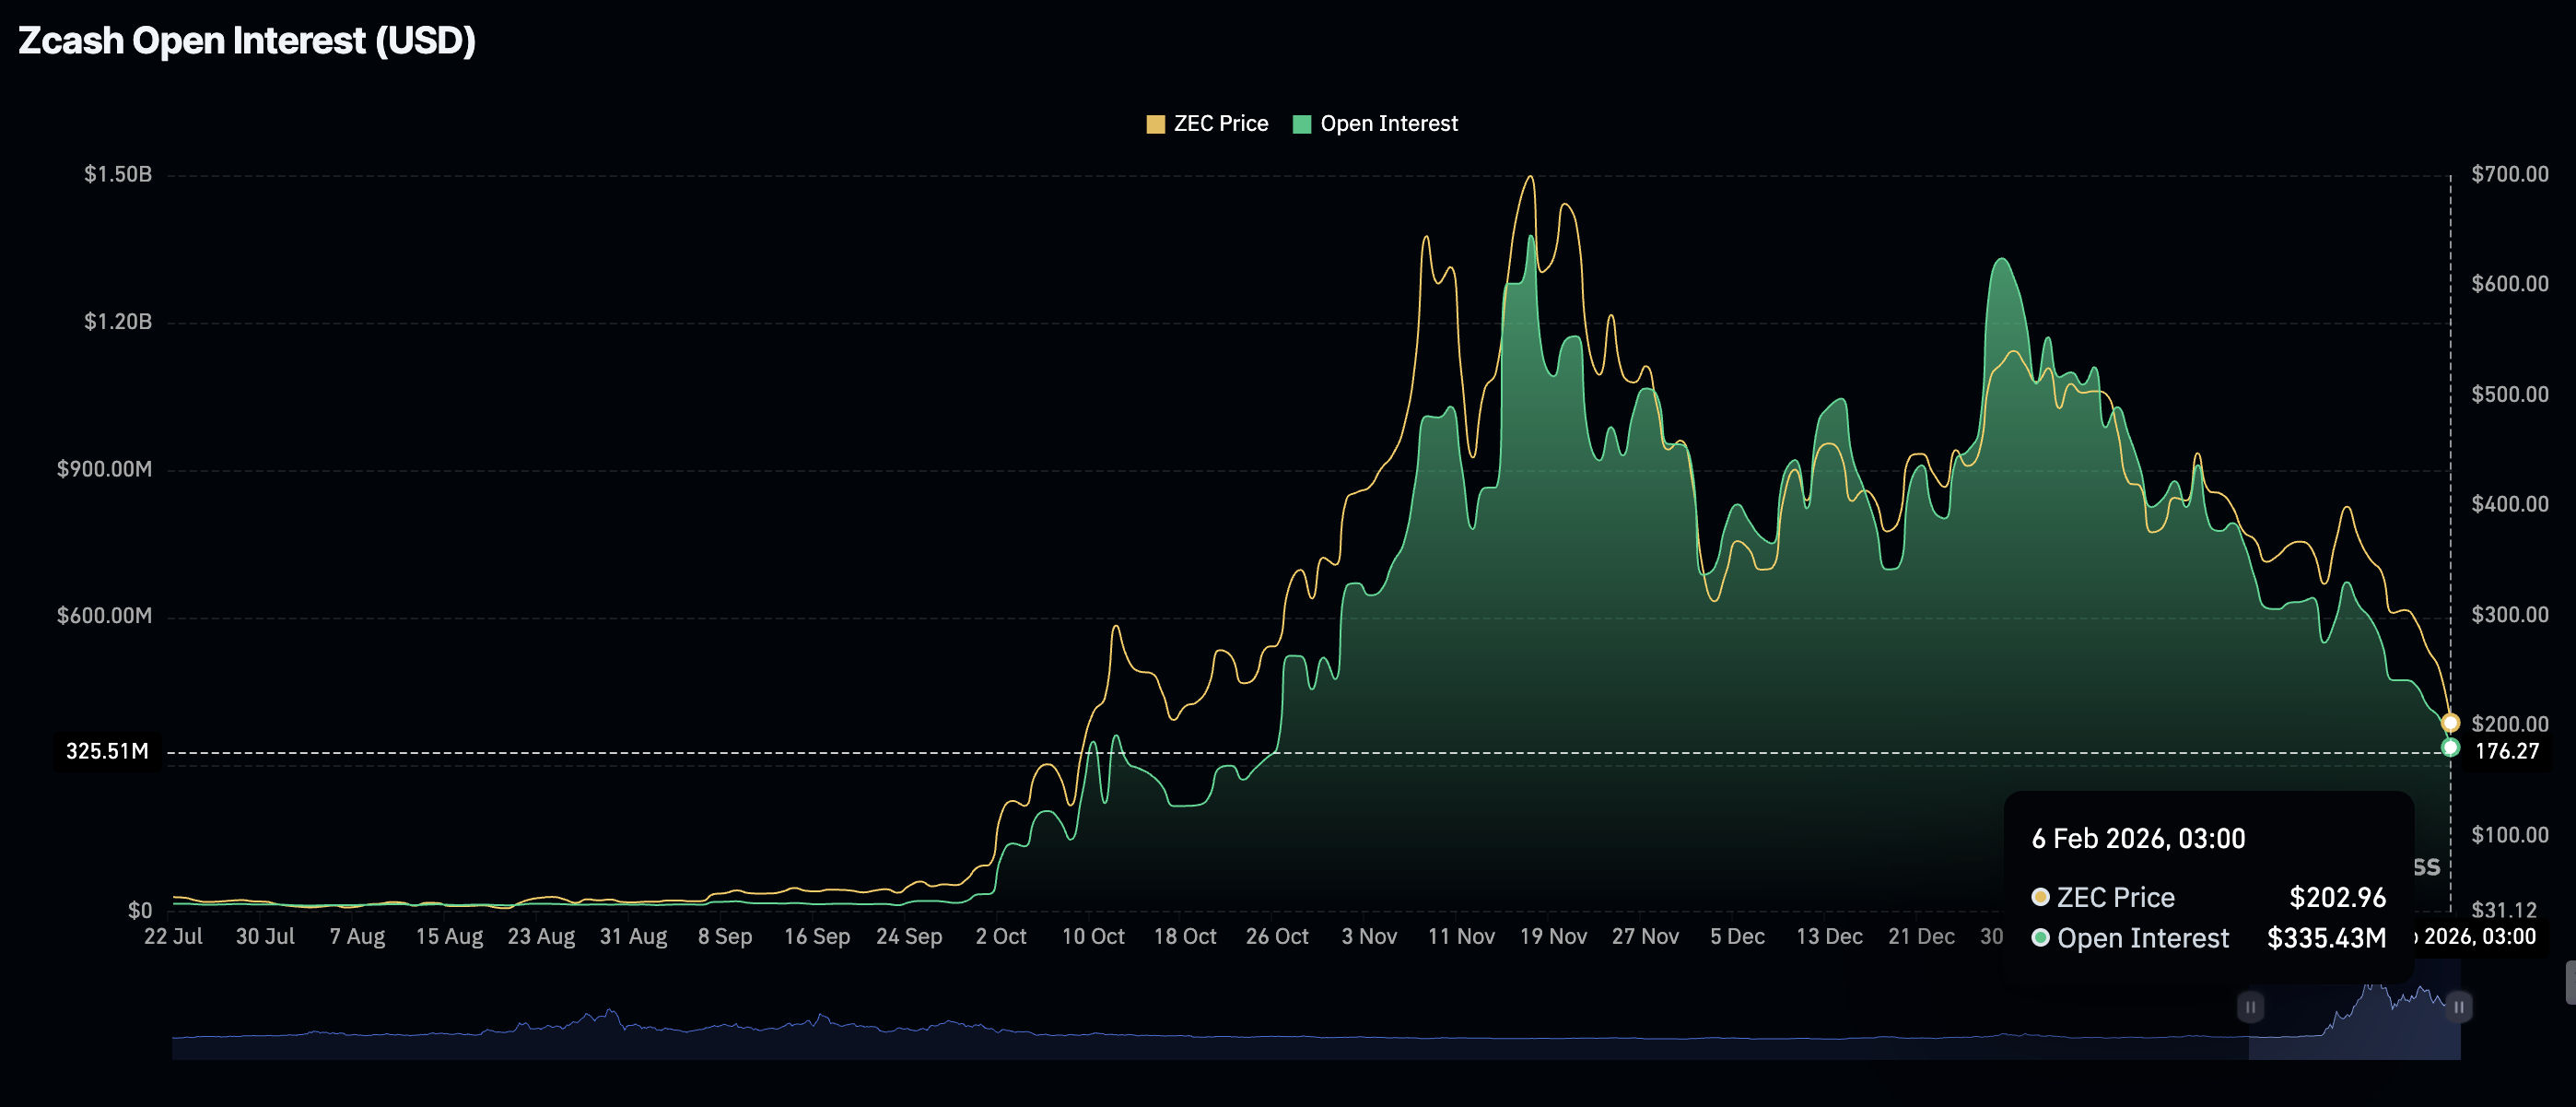
Zcash is extending gains despite a weak derivatives market, as futures Open Interest (OI) falls to $335 million on Friday, from $396 million the previous day.
Since OI tracks the notional value of outstanding futures contracts, a tenacious decline, as seen in ZEC from its record high of $1.38 billion in November, suggests that traders generally lack confidence in the underlying asset’s ability to recover or sustain an uptrend.
ZEC’s futures OI should steadily increase in tandem with the Zcash price, supporting a bullish outlook and increasing the odds of reclaiming key levels, such as the $300 supply zone.
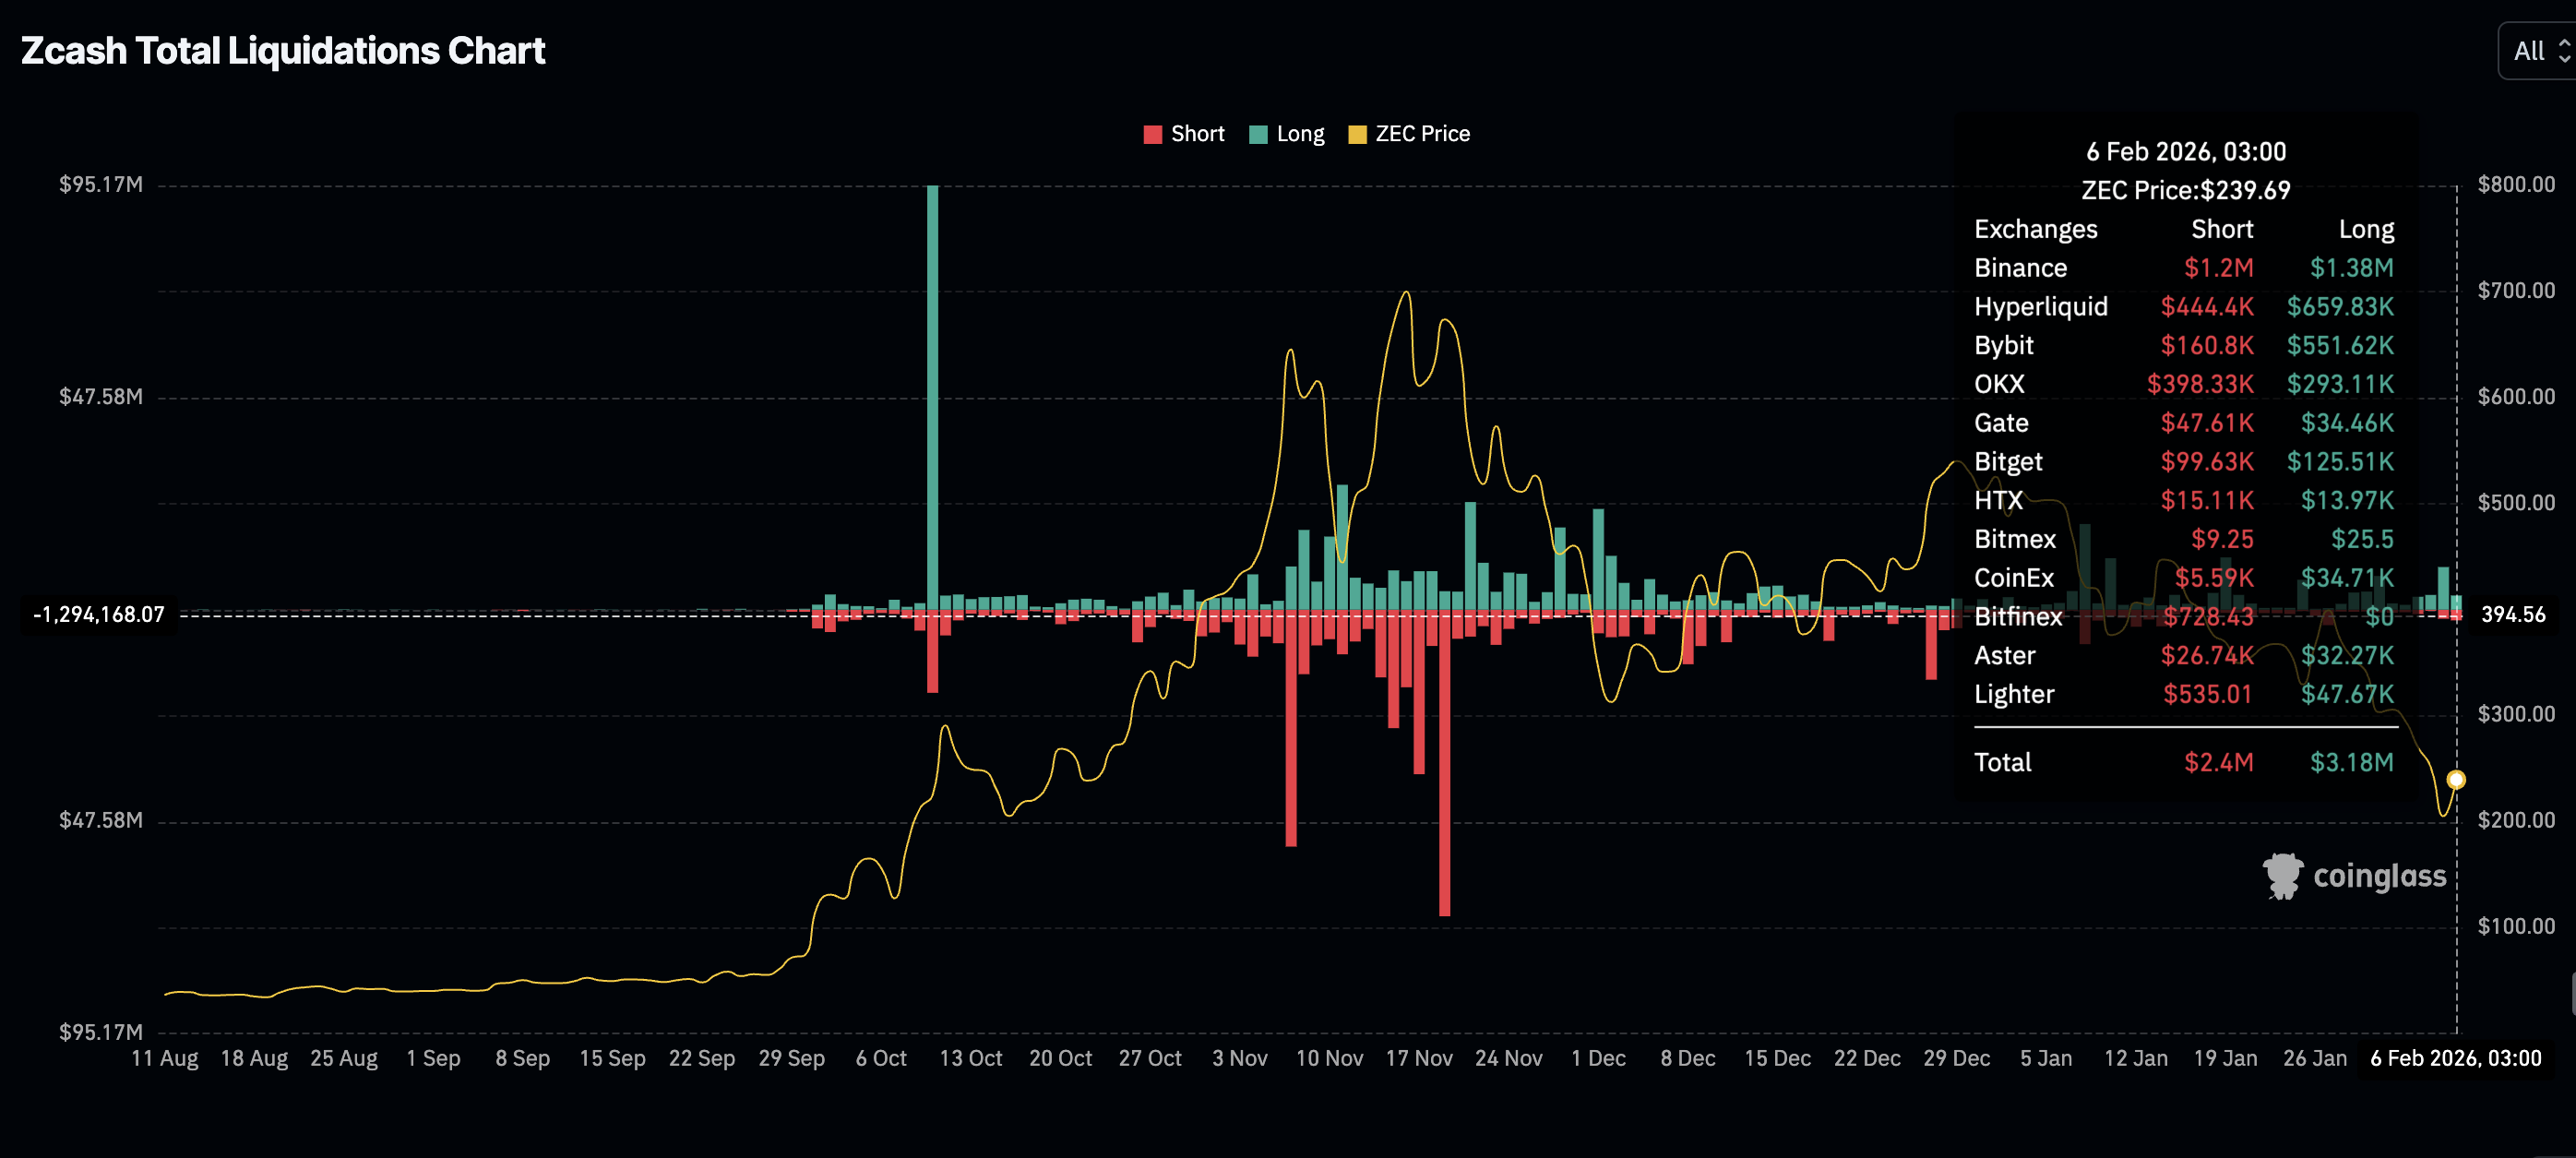
Meanwhile, pressure from liquidated positions has eased, given the ongoing price recovery. According to CoinGlass, approximately $3.2 million in longs and $2.4 million in shorts were liquidated on Friday, compared to $9.5 million in longs and $2 million in shorts on Thursday.
As the Zcash price rises, pressure on long positions is poised to ease, potentially supporting the recovery.
Assessing ZEC’s bullish outlook
Zcash hovers above $240 amid increasing intraday gains. This relief rally follows a violent crash that resulted in ZEC dropping over 40% since Sunday and 65% from January 1.
The Relative Strength Index (RSI) on the daily chart is rising to 32, confirming that bearish momentum is fading. A further increase toward the midline would accelerate the transition from the overall bearish trend to a fresh bullish phase.
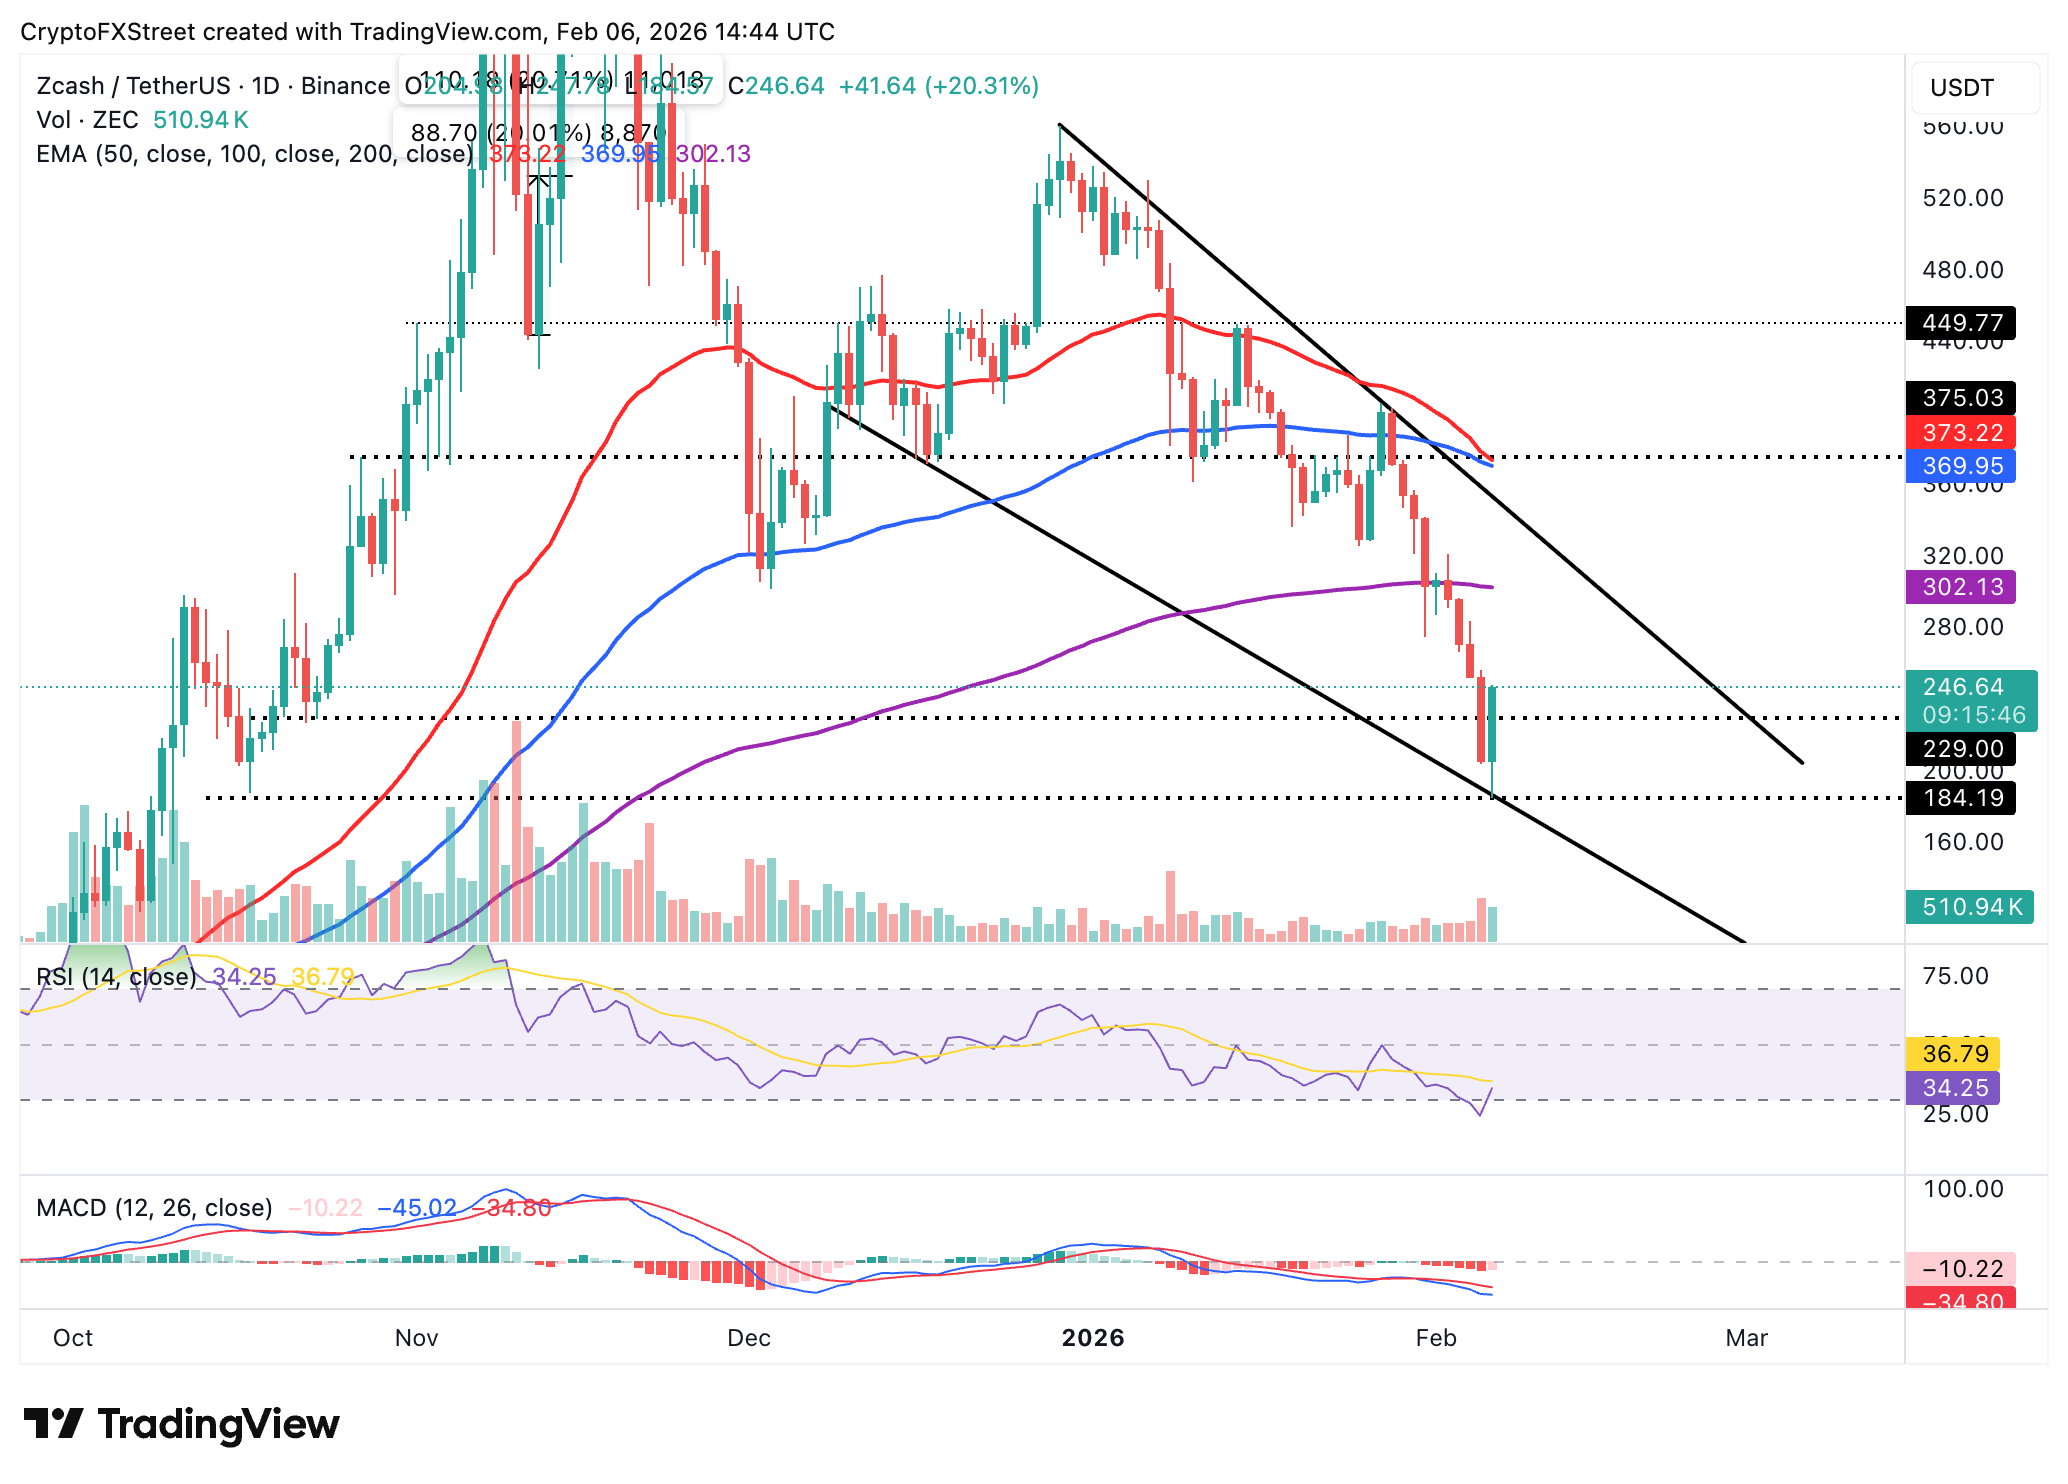
Key milestones that could reinforce the bullish grip include extending the price action beyond the 200-day Exponential Moving Average (EMA) at $302 and breaking the upper descending trendline resistance.
Still, traders should temper their expectations as the Moving Average Convergence Divergence (MACD) indicator remains below the signal line. If the negative histogram bars contract, signaling that investors are leaning into risk, the path of least resistance may remain upward.
The area between $230 and $240 is poised to absorb selling pressure amid possible profit-taking from investors who may have bought ZEC at intraday lows. The demand zone at $185 is still within reach unless ZEC steadily rises and reclaims the 200-day EMA as support.
Open Interest, funding rate FAQs
Higher Open Interest is associated with higher liquidity and new capital inflow to the market. This is considered the equivalent of increase in efficiency and the ongoing trend continues. When Open Interest decreases, it is considered a sign of liquidation in the market, investors are leaving and the overall demand for an asset is on a decline, fueling a bearish sentiment among investors.
Funding fees bridge the difference between spot prices and prices of futures contracts of an asset by increasing liquidation risks faced by traders. A consistently high and positive funding rate implies there is a bullish sentiment among market participants and there is an expectation of a price hike. A consistently negative funding rate for an asset implies a bearish sentiment, indicating that traders expect the cryptocurrency’s price to fall and a bearish trend reversal is likely to occur.
Author

John Isige
FXStreet
John Isige is a seasoned cryptocurrency journalist and markets analyst committed to delivering high-quality, actionable insights tailored to traders, investors, and crypto enthusiasts. He enjoys deep dives into emerging Web3 tren



