Tron price analysis: TRX/USD approaching contracting triangle breakout: Exchanges test TRX deposits and withdrawals


  • Binance has not resumed TRX deposits and withdrawals following the issues with Syscoin (SYS).
  • The buyers must fight to maintain the 100 SMA support.

Tron price attempts to retrace higher above $0.040 have been thwarted by the rising selling pressure. The price lacked the momentum to maintain above $0.040 sliding back to the range with support at $0.037. It is also nearing the breakout at the narrow end of the short-term contracting triangle.

The Tron network completed its transition from Ethereum blockchain and now has been said to be safe and exchanges are testing the token for deposits and withdrawals. The process is, however, cautioned because there may be confusion between the new Tron addresses and the previous Ethereum based addresses. Tron founder Justin Sun wrote on Twitter:

“TRON mainnet upgrade has been completed. Deposit will be available from July 4, 6PM (GMT+8). TRON withdrawal service has been disabled, kindly stay tuned to our announcement for updates.”

Binance has not resumed TRX deposits and withdrawals following the issue with Syscoin (SYS). OKEx, on the other hand, has already started withdrawals and deposits of the token. The transaction speed has also increased with Tron now doing a few thousand transactions daily. The number is also expected to rise as the activities on Tron network increase.

Tron price analysis

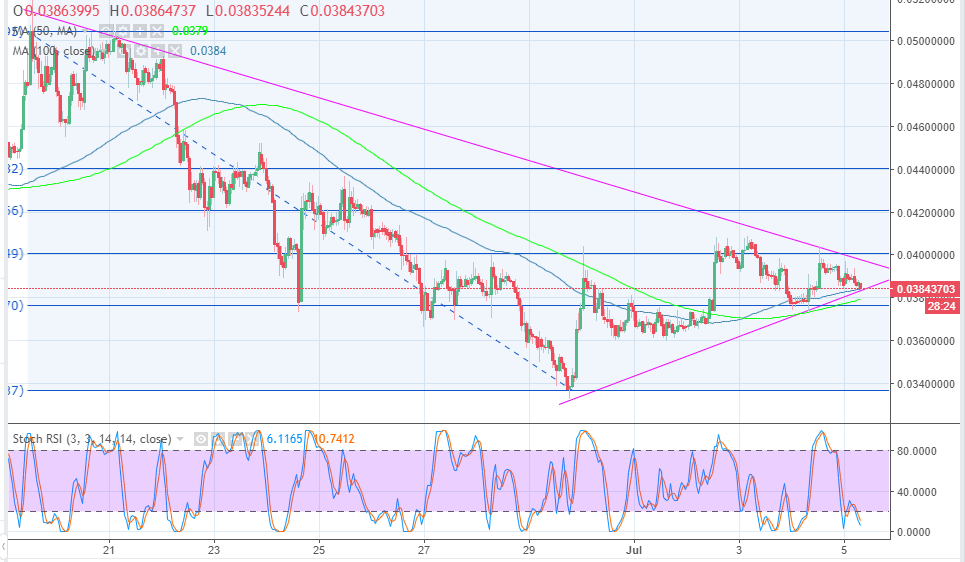
Technically, Tron is trading at $0.038 while it is supported by the 100 Simple Moving Average around $0.0383 on the 1-hour timeframe chart. The 50 SMA is also positioned as another support at $0.0379. There is a breakout in the pipeline and trading above the 38.2% Fib retracement level with the last swing high of $0.050 and a swing low of $0.0336 at $0.040 could see TRX/USD extending the gains towards the critical resistance area at $0.050. In the meantime, the buyers must fight to maintain the 100 SMA support, besides the stochastic RSI is moving further south to signal the presence of bear pressure.

TRX/USD 1-hour chart


Information on these pages contains forward-looking statements that involve risks and uncertainties. Markets and instruments profiled on this page are for informational purposes only and should not in any way come across as a recommendation to buy or sell in these assets. You should do your own thorough research before making any investment decisions. FXStreet does not in any way guarantee that this information is free from mistakes, errors, or material misstatements. It also does not guarantee that this information is of a timely nature. Investing in Open Markets involves a great deal of risk, including the loss of all or a portion of your investment, as well as emotional distress. All risks, losses and costs associated with investing, including total loss of principal, are your responsibility. The views and opinions expressed in this article are those of the authors and do not necessarily reflect the official policy or position of FXStreet nor its advertisers. The author will not be held responsible for information that is found at the end of links posted on this page.

If not otherwise explicitly mentioned in the body of the article, at the time of writing, the author has no position in any stock mentioned in this article and no business relationship with any company mentioned. The author has not received compensation for writing this article, other than from FXStreet.

FXStreet and the author do not provide personalized recommendations. The author makes no representations as to the accuracy, completeness, or suitability of this information. FXStreet and the author will not be liable for any errors, omissions or any losses, injuries or damages arising from this information and its display or use. Errors and omissions excepted.

The author and FXStreet are not registered investment advisors and nothing in this article is intended to be investment advice.

Recommended content


Recommended Content

Editors’ Picks

Bitcoin Weekly Forecast: Fed-led rally could have legs towards $65,000

Bitcoin Weekly Forecast: Fed-led rally could have legs towards $65,000

Bitcoin has risen 7% so far this week, supported by the US Fed interest-rate cut and more than $300 million in ETFs inflows. The recent surge led BTC price to shatter several key technical resistance levels, a sign that the current two-week rally has likely some more way to go towards $65,000.

More Bitcoin News
Ethereum, BNB and POL holders on the watch as BingX faces loss of $26 million in hack

Ethereum, BNB and POL holders on the watch as BingX faces loss of $26 million in hack

Crypto exchange BingX said on Friday that it suffered a hack, an attack that led to “minimal” losses that researchers at PeckShield estimate at $26.68 million.  The attacker swapped the stolen altcoins for Ethereum, Binance Coin and Polygon tokens, according to on-chain data. 

More Cryptocurrencies News
Pepe price forecast: Eyes for 30% rally

Pepe price forecast: Eyes for 30% rally

Pepe extends the upward movement on Friday after breaking above the descending trendline and resistance barrier on Thursday. PEPE’s dormant wallets are in motion, and the long-to-short ratio is above one, further supporting this bullish move and hinting at a rally on the horizon.

More PEPE News
Shiba Inu is poised for a rally as price action and on-chain metrics signal bullish momentum

Shiba Inu is poised for a rally as price action and on-chain metrics signal bullish momentum

Shiba Inu remains strong on Friday after breaking above a symmetrical triangle pattern on Thursday. This breakout signals bullish momentum, further bolstered by a rise in daily new transactions that suggests a potential rally in the coming days.

More Shiba Inu News
Bitcoin: Fed-led rally could have legs towards $65,000

Bitcoin: Fed-led rally could have legs towards $65,000

Bitcoin (BTC) has risen 7% so far this week, supported by the US Federal Reserve (Fed) interest-rate cut and more than $300 million in ETFs inflows. The recent surge led BTC price to shatter several key technical resistance levels, a sign that the current two-week rally has likely some more way to go towards $65,000.

Read full analysis
Moneta Markets review 2024: All you need to know

Moneta Markets review 2024: All you need to know

VERIFIED In this review, the FXStreet team provides an independent and thorough analysis based on direct testing and real experiences with Moneta Markets – an excellent broker for novice to intermediate forex traders who want to broaden their knowledge base.

Read More

BTC

ETH

XRP