Top 3 Price Prediction Bitcoin, Ripple, Ethereum: Technical confusion ceremony in process
- There are contradictory signals in the short term.
- The medium-term analysis continues pointing to more rises.
- BTC/USD holds up better than its teammates on the podium.

The first hour falls along the Crypto board bring us back to a slow and tiring reality.
The mirage of a return to the unreasonable vertical rise is over, and we return to the reality of a market that reflects in its way of moving through the price chart in a more mature manner.
The falls have sent prices to look for initial support lines, mainly exponential averages, but again it is the ETH/BTC chart that gives me more information about the situation.
Do you want to know more about my technical setup?
BTC/USD 240 Minute Chart
The BTC/USD pair is currently trading at $5,196 after setting the relative high at the $5,468. Of the Top 3 cryptocurrencies, Bitcoin is the one that is the best at weathering the current moment of weakness, but it is going to be complicated not to continue downward until at least the first support level.
Below the current price, the first resistance level is at $5,490 (price congestion resistance). The second resistance level is a strong confluence of three price congestion resistance between $6,300 and $6,500. The market is anxiously waiting for Bitcoin to breach this level and enter the neutral zone of the historical price range.
Below the current price, the first support level is $5,050 (price congestion support and EMA50), then the second support level is $4,600 (price congestion support and SMA100). The third level of support for the BTC/USD pair is at $4,250 (SMA200 and price congestion support).
It is worth noting the presence of confluences in the three levels of support, which brings strength to the current position of Bitcoin.
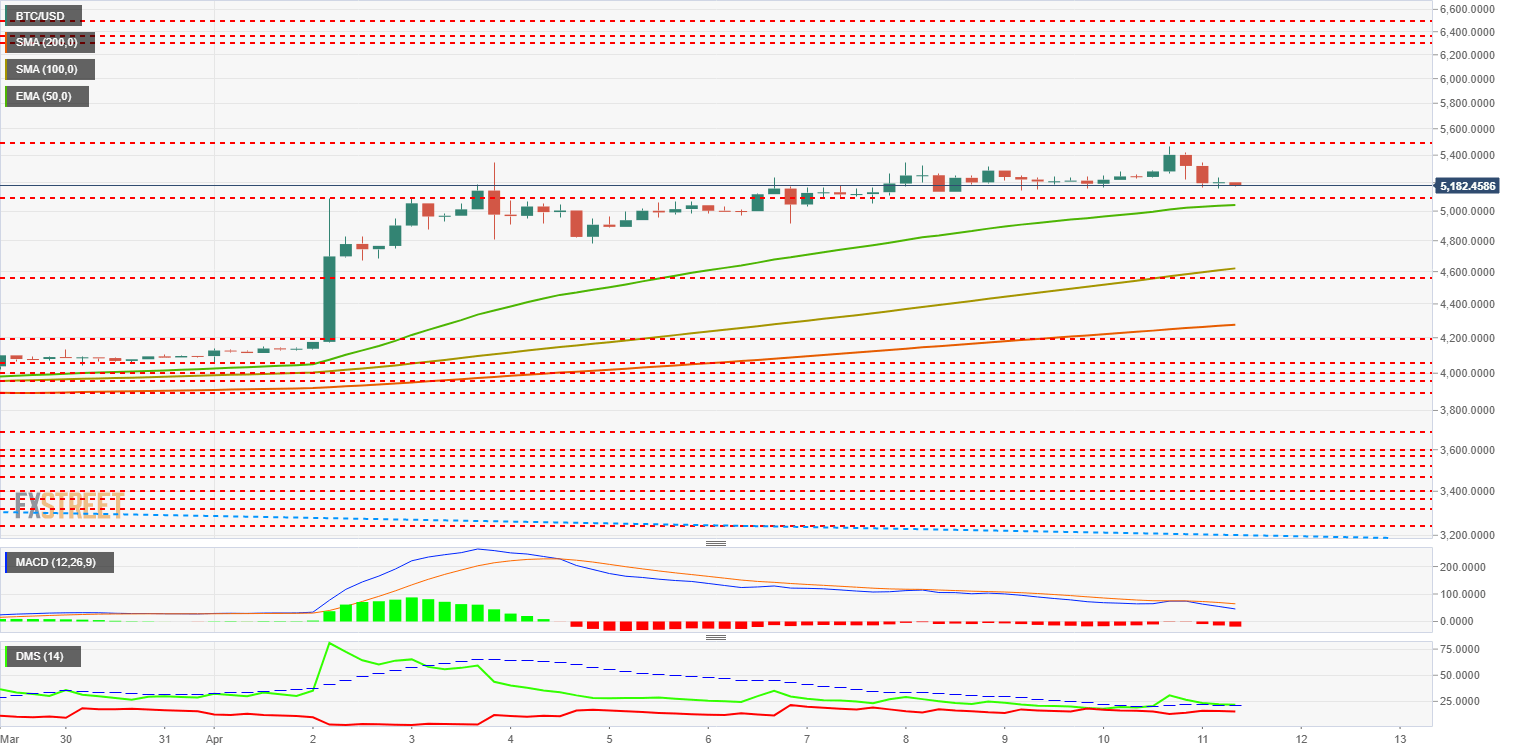
The MACD on the 4-hour chart continues to cross down with very little inclination and also minimal opening between the lines. It remains in the positive zone of the indicator, so a slightly bearish lateral behavior is very likely.
The DMI on the 4-hour chart shows bulls with a small advantage over bears, although it is more relevant that they remain above the ADX line, which would facilitate the bullish side of the market.
ETH/USD 240 Minute Chart
The ETH/USD is currently trading at the $169 price level and is moving below the EMA50. The loss of this support line would open up a bearish continuation scenario.
Above the current price, the first resistance level is at $169.6 (EMA50), then the second resistance level is at $180 (congestion resistance). The third resistance level for the ETH/USD pair is at $190 (price congestion resistance).
Below the current price, the first support level is at $161.3 (price congestion support), so the second support level for the ETH/USD pair is at $156 (SMA100). The third level of support is at $150 (price congestion support).
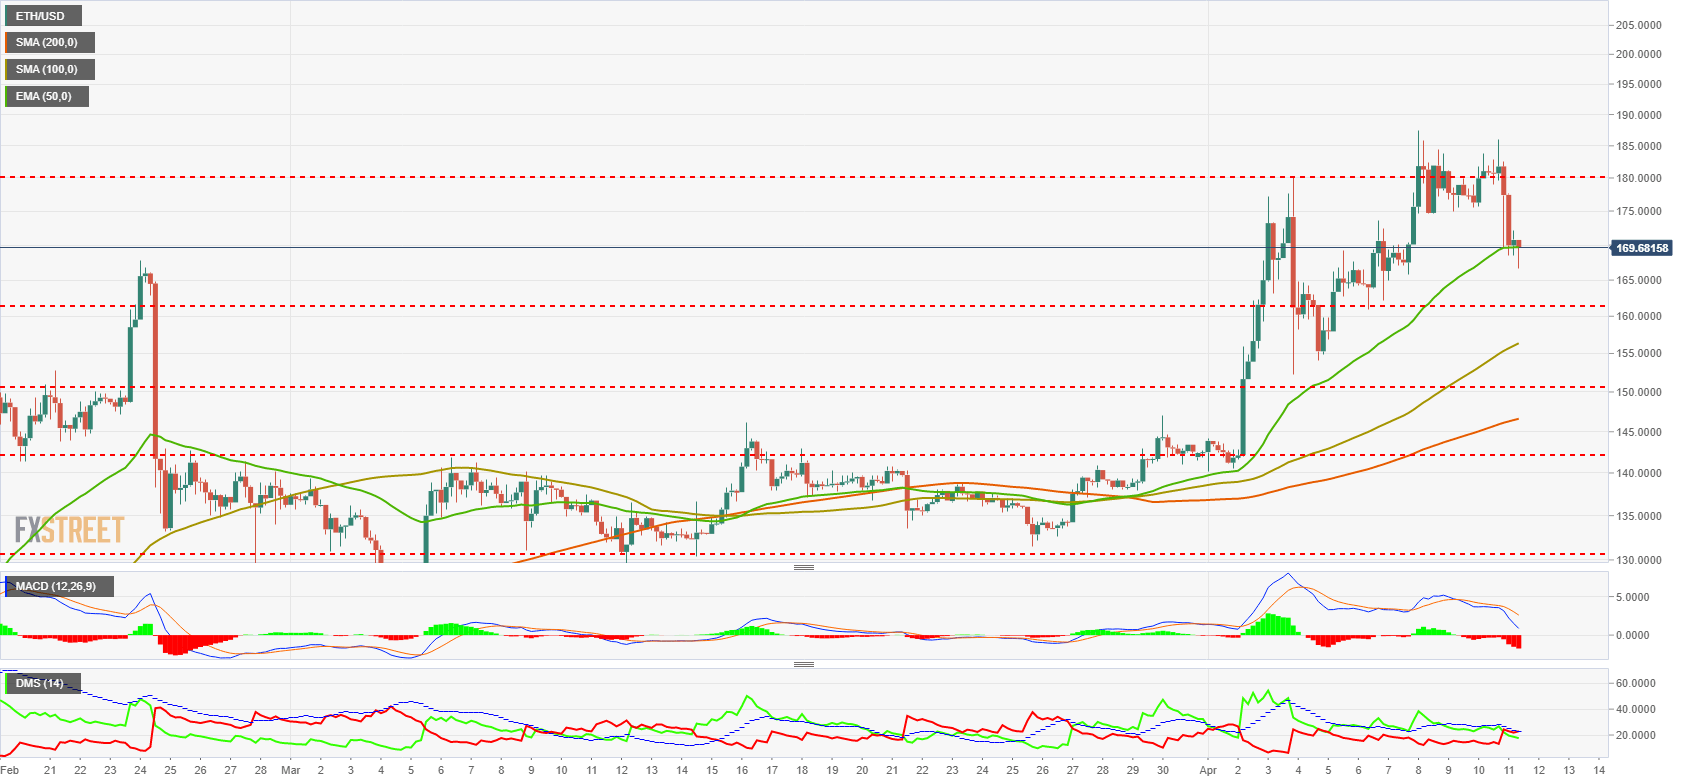
The MACD on the 4-hour chart is cross down, gaining inclination and openness in the last few hours. As in the case of the ETH/BTC pair, the opening is a bit extreme and can cause a rebound to the upside.
The DMI on the 4-hour chart shows us that bears are beating bulls by the minimum but not getting past the ADX line. The bulls withdraw, but the proximity of the bears and the ADX means that the situation can change very quickly.
XRP/USD 240 Minute Chart
The XRP/USD trades at $0.336. Yesterday's structure turns out to be a hoax and goes from candidate to market leader to today's worst of the top crypto protagonists.
The XRP was in a wide area free of supports and resistance but failed to reach the top support, and when sellers appeared, the journey to the first level of support has been painful.
Above the current price, the first resistance level is at $0.348 (EMA50), so the second resistance level for the XRP/USD pair is at $0.366 (price congestion resistance). The third resistance level is at $0.39 (price congestion resistance).
Below the current price, the first support level is at $0.334 (price congestion support and SMA100). The second support level for the XRP/USD pair is $0.328 (price congestion support), then the third support level is $0.323 (SMA200).
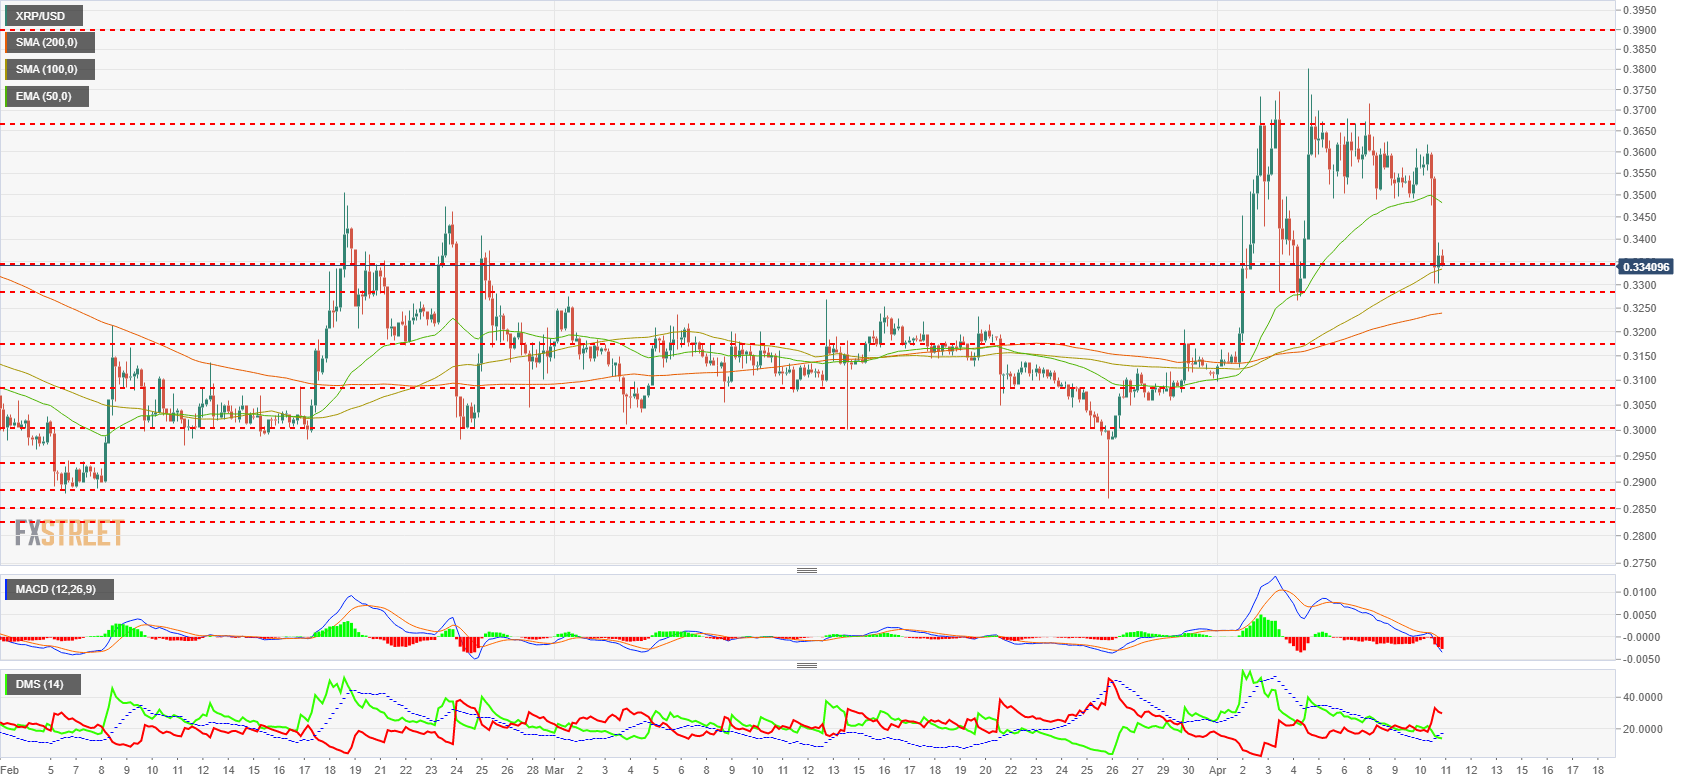
The MACD on the 4-hour chart presents a "MACD Failure" pattern and should lead to a bullish cross in the next few hours. On the downside, the fact that the continuity of the pattern has led the averages to the negative zone of the indicator subtracts strength and jeopardizes the scenario.
The DMI on the 4-hour chart shows bears dominating the market, while bulls retreat below the ADX line. This structure is bearish, and only a sudden reaction to the upside could turn a weakness scenario around in the short term.
Get 24/7 Crypto updates in our social media channels: Give us a follow at @FXSCrypto and our FXStreet Crypto Trading Telegram channel
Author

Tomas Salles
FXStreet
Tomàs Sallés was born in Barcelona in 1972, he is a certified technical analyst after having completing specialized courses in Spain and Switzerland. He expanded his technical training following the guidance of great experts on the financial markets.


