Bitcoin Price Forecast: BTC slips below $68,000 as defensive stance limits recovery
- Bitcoin edges lower on Tuesday, extending consolidation in a trading range for over ten days.
- Market conditions remain defensive, with sustainable recovery depending on renewed spot demand, report says.
- The technical outlook suggests BTC could revisit the $60,000 low if it breaks below the lower consolidation boundary.

Bitcoin (BTC) is trading below $68,000 at the time of writing on Tuesday after facing rejection near the upper consolidation boundary. A Glassnode report highlights that the market conditions remain defensive for the Crypto King, keeping the sideways market intact, while a sustainable recovery depends on renewed spot demand. Meanwhile, the technical outlook suggests BTC could fall further toward the $60,000 mark if it breaks below the lower consolidating boundary.
Traders remain defensive, supporting the ongoing range-bound market
Bitcoin price has consolidated between $65,700 and $72,000 over the past ten days, with no clear directional bias. Glassnode reported on Monday that the overall market conditions remain defensive across spot, derivatives, ETFs, and on-chain indicators.
The chart below shows that Spot CVD has improved from -$352.9 million in early February to -$193.9 million on Monday, signalling a cooling in sell-side pressure. However, the value remains negative, falling within the statistical bands (red and green), indicating neutral market aggression and early signs of stabilisation.
In addition, the spot volume has fallen (48.3%) from $15.8 billion in early February to $8.2 billion on Monday, nearing the lower statistical band (red), signalling a sharp drop in investors’ participation.
“This points to fading conviction and consolidation-style regime, where price is more likely to drift or stabilise until a fresh catalyst brings volume back,” says Glassnode’s analyst.
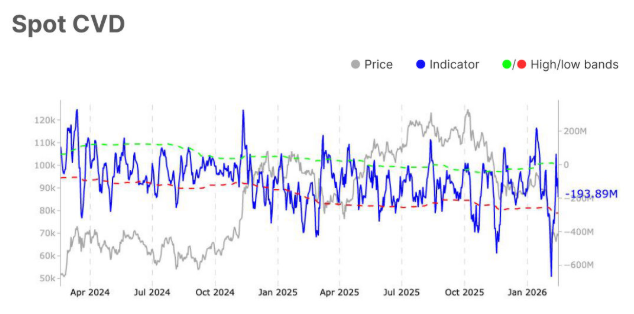
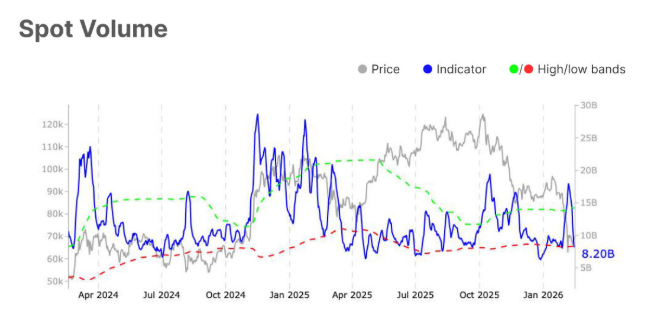
The analyst concluded that, “While sell pressure appears to be moderating, participation and capital flows remain weak, leverage is still being reduced, and risk may be underpriced in options markets. A durable recovery still depends on renewed spot demand capable of sustaining price beyond the recent rebound zone.”
Weaker accumulation seen at $60,000
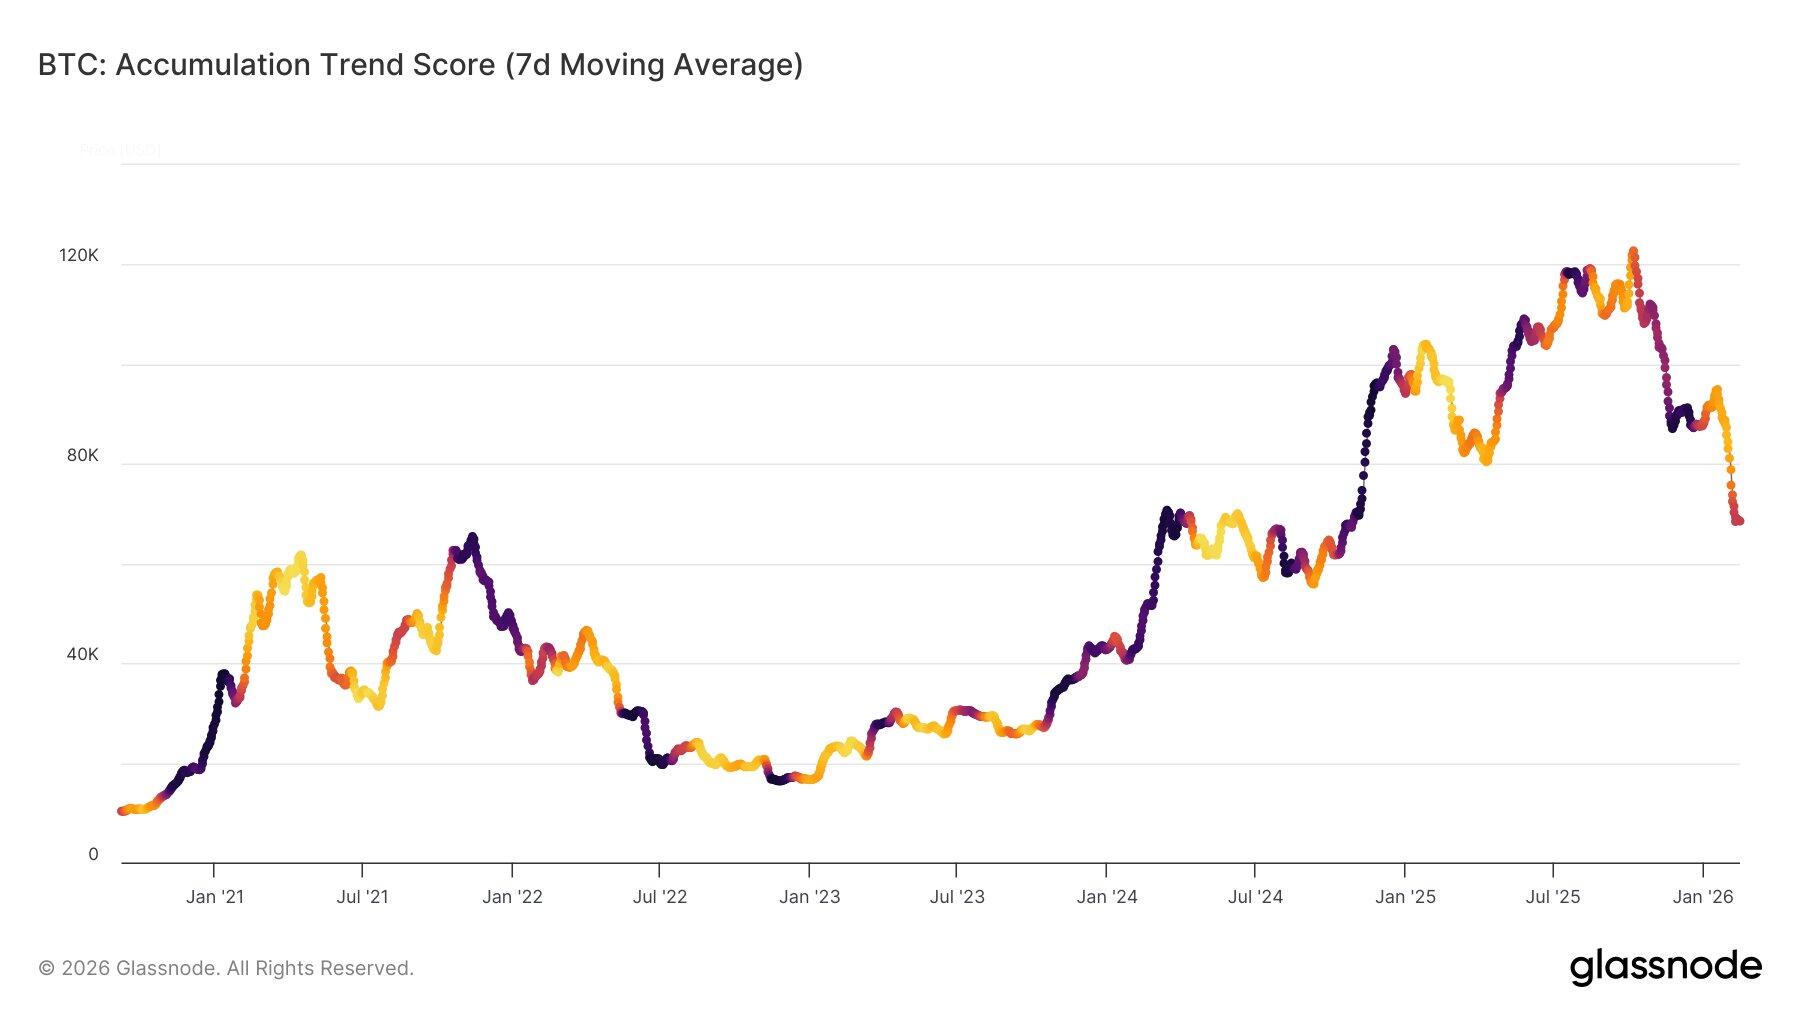
The Bitcoin accumulation trend score (7-day Moving Average) chart below shows that during the first down leg in November 2025, the market absorbed heavy selling pressure aggressively, similar to the post-LUNA & FTX crash responses.
However, in the second leg, the recent drop to $60,000 on February 6 saw accumulation weaker than the strong, aggressive dip-buying that followed the LUNA crash. This indicates that current buying interest lacks the urgency and intensity seen during past major capitulation events, which could reinforce the current defensive, range-bound market structure.
Bitcoin Price Forecast: BTC could test $60,000 if it closes below the lower consolidation boundary
Bitcoin price has been consolidating in a range between $65,729 and $71,746 since February 7. As of Tuesday, BTC is trading below $68,000, heading toward the lower consolidation boundary.
If the Crypto King closes below the lower consolidation level at $65,729, it could extend the decline toward the key support level at $60,000.
The Relative Strength Index (RSI) on the daily chart reads 34, below the neutral level of 50 and pointing downward toward the oversold levels, indicating bearish momentum gaining traction.
However, the Moving Average Convergence Divergence (MACD) showed a bullish crossover on Sunday, which remains in place, suggesting that upside bias has not been invalidated yet.
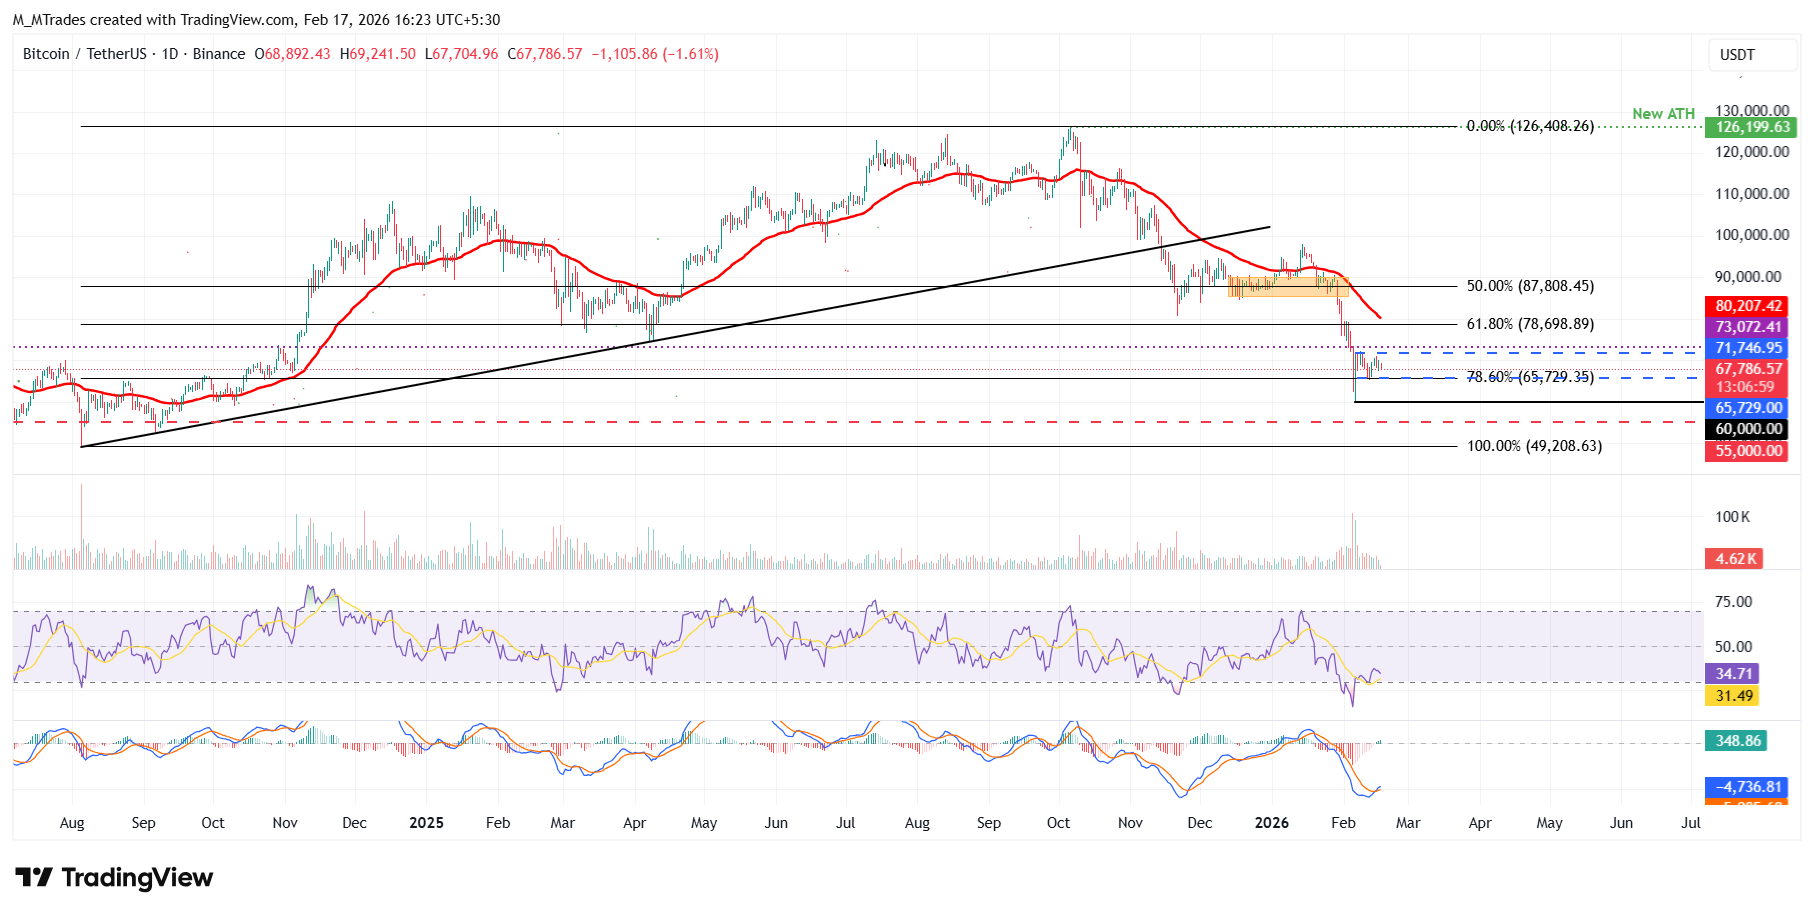
On the other hand, if BTC breaks above the upper consolidation range at $71,746, it could extend the recovery toward the daily resistance at $73,072.
Bitcoin, altcoins, stablecoins FAQs
Bitcoin is the largest cryptocurrency by market capitalization, a virtual currency designed to serve as money. This form of payment cannot be controlled by any one person, group, or entity, which eliminates the need for third-party participation during financial transactions.
Altcoins are any cryptocurrency apart from Bitcoin, but some also regard Ethereum as a non-altcoin because it is from these two cryptocurrencies that forking happens. If this is true, then Litecoin is the first altcoin, forked from the Bitcoin protocol and, therefore, an “improved” version of it.
Stablecoins are cryptocurrencies designed to have a stable price, with their value backed by a reserve of the asset it represents. To achieve this, the value of any one stablecoin is pegged to a commodity or financial instrument, such as the US Dollar (USD), with its supply regulated by an algorithm or demand. The main goal of stablecoins is to provide an on/off-ramp for investors willing to trade and invest in cryptocurrencies. Stablecoins also allow investors to store value since cryptocurrencies, in general, are subject to volatility.
Bitcoin dominance is the ratio of Bitcoin's market capitalization to the total market capitalization of all cryptocurrencies combined. It provides a clear picture of Bitcoin’s interest among investors. A high BTC dominance typically happens before and during a bull run, in which investors resort to investing in relatively stable and high market capitalization cryptocurrency like Bitcoin. A drop in BTC dominance usually means that investors are moving their capital and/or profits to altcoins in a quest for higher returns, which usually triggers an explosion of altcoin rallies.
Author

Manish Chhetri
FXStreet
Manish Chhetri is a crypto specialist with over four years of experience in the cryptocurrency industry.



