Top 3 Price Prediction Bitcoin, Ripple, Ethereum: BTC is back bigtime as bulls put on space suits
- The current movement is similar to that seen in December 2017.
- The weakness of Ethereum could last a few days.
- The squeeze on XRP last week is also connected to what happened today.

In yesterday's analysis of the BTC/USD pair I wrote:
The DMI on the 4-hour chart on both sides of the market remains below the ADX line, which implies a layer of general weakness for both sides of the market. This type of structure facilitates the appearance of violent and unexpected movements."
Well, that's what happened. We are finally seeing extreme rises for the crypto market and especially for Bitcoin. Yesterday the market gave us some clues, like the one mentioned above or the crossing point we saw in the DMI on the ETH/BTC pair.
ETH/BTC 240 Minute Chart
The ETH/BTC pair reflects the inverse of what we will see in the Bitcoin chart. The spectacular development of King Crypto against Ethereum breaks the graph down and sends the price to the base of the great structure of parallel trend lines that governs this pair.
I have always argued that for the Cryptocurrencies market to be in bullish mode, Ethereum has to do better than Bitcoin. Until now it has always been like that. In December 2017, just before the large market rise, the market did the same thing it is doing now.
The ETH/BTC pair is currently trading at the price level of 0.0321, after leaving the session low of 0.0305.
Above the current price, ETH/BTC is facing its first resistance at 0.032 (price congestion resistance). Then, the second resistance level is at 0.0333 (price congestion resistance and intermediate parallel trendline). The third resistance level for the ETH/BTC pair is at 0.035 (price congestion resistance and intermediate parallel trendline).
Below the current price, the first support level for the ETH/BTC pair is 0.0315 (price congestion support), then the second support level is 0.0305 (price congestion support and parallel baseline).
-636897959869208157.png)
The MACD on the 4-hour chart shows a strong downtrend and a good opening between the lines. This structure can either develop a broad bearish trend or bounce upward to correct the excess.
The DMI on the 4-hour chart shows that the bulls fired and at levels not seen in many months. On the other hand, the bulls have withdrawn but not with the same magnitude with which the bears stand out.
Do you want to know more about my technical setup?
BTC/USD 240 Minute Chart
The BTC/USD pair is currently trading at $4.711 after hitting the daily high at $5.089. The level reached is not coincidental. It coincides precisely with the base of the bearish side channel that governed the movement of BTC/USD from February to October 2018. You can see it by clicking on the lower chart and changing the time frame to the daily range.
Above the current price, the first resistance level is at $5,500 (price congestion resistance), while the second resistance level is in a confluence zone formed by three levels of price congestion resistance at $6,300, $6,400 and $6,500. Above these levels, BTC/USD would be back to the previous scenario, and the right thing would be to restart it once again.
Below the current price, the first level of support is at $4,550 (price congestion support), then the second level of support at $4,200 (price congestion support) and the third level of support is a massive confluence zone between $4,100 and $3,900 formed by the SMA200 at $3,928, the SMA100 at $4,017 and the EMA50 at $4,100, plus 5 levels of price congestion support.
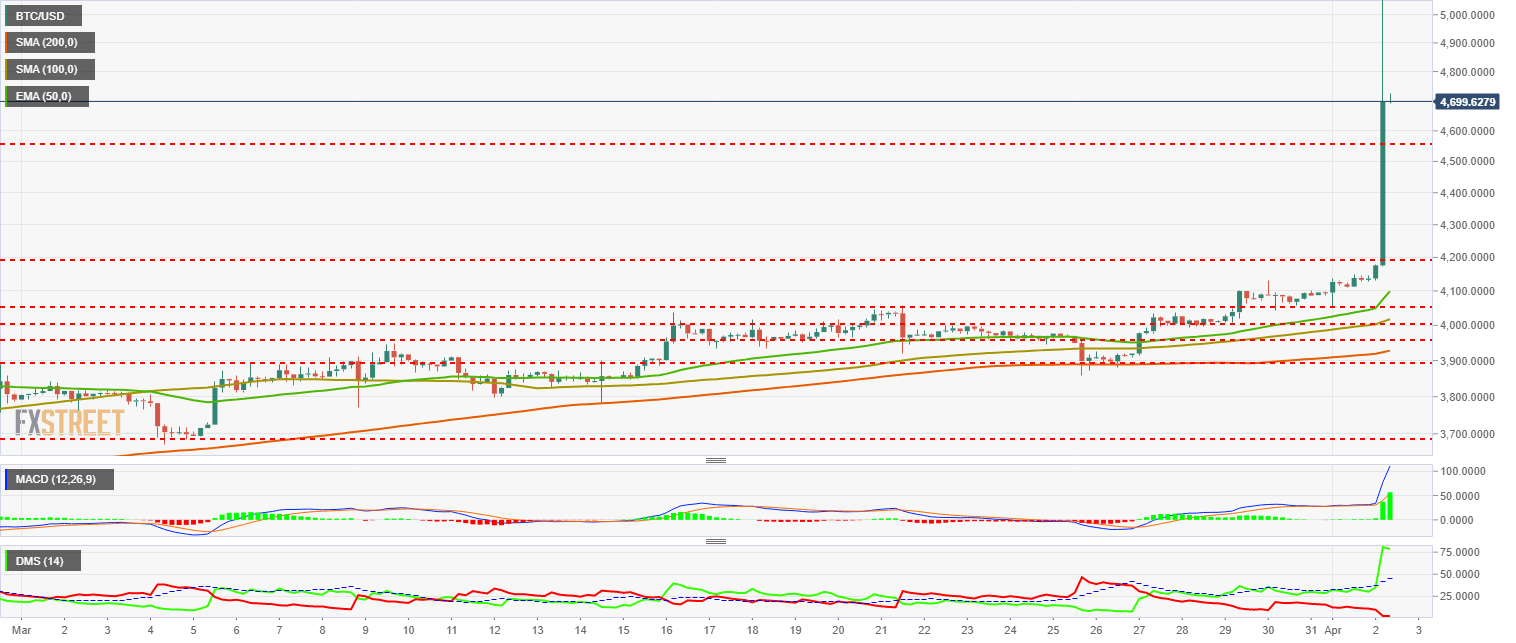
The MACD on the 4-hour chart reflects the violence of the rally. The slope is a maximum one, and the opening is very extreme. It is very likely that there will be a movement that relaxes the current extreme.
The DMI on the 4-hour chart shows us that bulls are in control of the market and at very high levels, not seen in many months. The bears, on the other hand, sink and similarly mark the lowest levels in many months.
ETH/USD 240 Minute Chart
The ETH/USD pair is currently trading at the $152.5 price level, after overcoming resistance at $150.5.
Above the current price, the first resistance level for the ETH/USD pair is at $162 (price congestion resistance). The second resistance level is at $180 (price congestion resistance) and the third is $200 (price congestion resistance).
Below the current price, the first support level is at $150.5 (price congestion support). So, the second support level for the ETH/USD pair is a confluence formed by a price congestion support at $142.5, the EMA50 at $141, the SMA100 at $139 and the SMA200 at $137. The third support level is at the price level of $130 (price congestion support).
-636897964073846327.png)
The MACD on the 4-hour chart crosses upward but without the violence of Bitcoin. The bullish inclination is essential but there is hardly any separation between the lines.
The DMI on the 4-hour chart shows some more forcefulness, with bulls at peak levels as bears sink and already move below the ADX.
XRP/USD 240 Minute Chart
The XRP/USD is currently trading at the $0.333 price level, after leaving today's high at the $0.3450 price level.
Above the current price, the first resistance level is at $0.390 (price congestion resistance), then a second resistance level at $0.435 (price congestion resistance) and the third resistance level at $0.47 (price congestion resistance).
Below the current price, the first support level is at the price level of $0.33 (price congestion support), then the second support level at $0.318 (price congestion support, EMA50, SMA100, and SMA200). An excellent level of support. The third level of support is $0.309 (price congestion support).
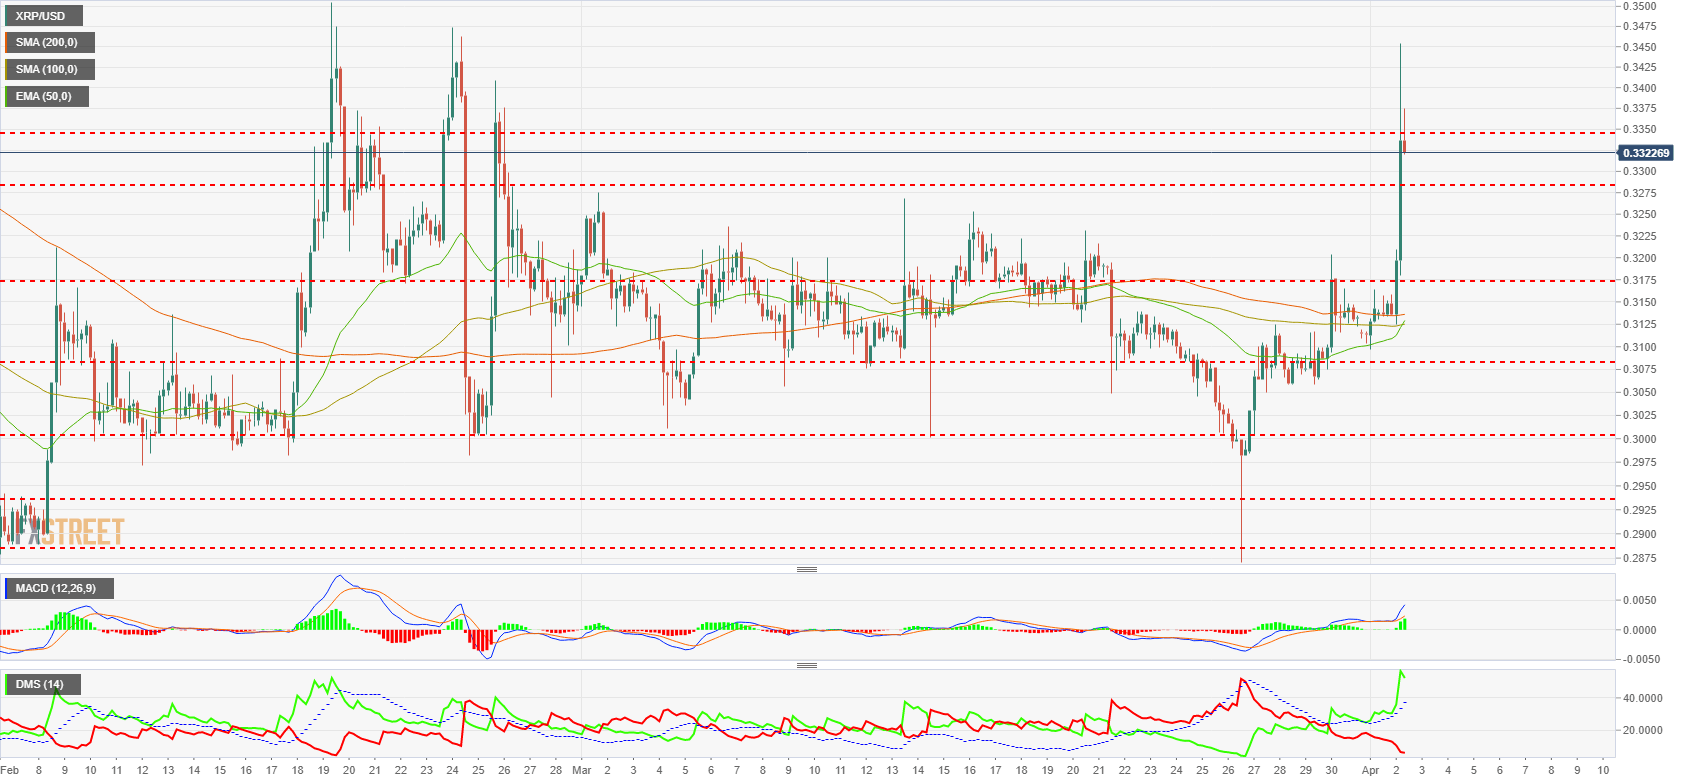
The MACD on the 4-hour chart shows how the lines lean higher, and the opening between them increases.
The DMI on the 4-hour chart clearly expresses the moment and shows the bulls at many month highs while sending the bears to very extreme low levels.
Get 24/7 Crypto updates in our social media channels: Give us a follow at @FXSCrypto and our FXStreet Crypto Trading Telegram channel
Author

Tomas Salles
FXStreet
Tomàs Sallés was born in Barcelona in 1972, he is a certified technical analyst after having completing specialized courses in Spain and Switzerland. He expanded his technical training following the guidance of great experts on the financial markets.


