Top 3 Price Prediction Bitcoin, Ripple, Ethereum: The market moves upwards, unaware of exhaustion signals
- ETH struggles to keep pace with BTC.
- XRP does not accompany the moment and raises the danger signal.
- After months of falls, it is necessary to change the inertia.

On the first day of April and at the beginning of the European session, the positive tone continues in the cryptocurrencies sector. The bullish progress of the last few days is not happening at the speed that the bulls would like, but this is the result after months of falls that except for the initial phase from historical highs and the breakdown of the $6,000 price level, have always been very slow.
During the months of falls, a structure of supports has been created. As these are now very dense resistance lines, it now complicates the bullish task.
The question about the reliability of the actual movement remains on the table, and the answer remains difficult. It is a probable scenario, but we must bear in mind that the bullish turn from the December lows is impacting on very long timeframes that burden the price to the same extent that they support and give strength.
ETH/BTC 240 Minute Chart
Last Friday, the ETH/BTC pair did not manage to consolidate the bullish break of the resistance at 0.0350, and the price is back to the lower segment of the chart.
Above the current price, the first bullish target for the ETH/BTC pair is to regain the failed level on Friday at 0.035 (price congestion resistance, looking from there for the second resistance level at the price level of 0.0365 (upper parallel trend line). The third resistance level is at the price level of 0.038 (price congestion resistance).
Below the current price, the first support level is at 0.0333 (lower parallel trendline and price congestion support), then the second support level is at 0.0325 (trendline). The third support level for the ETH/BTC pair is at 0.0316 (price congestion support).
-636897065610535528.png)
The MACD on the 4-hour chart shows a cross profile on the downside but within the positive zone of the indicator. The profile of the lines invites to wait for a new bullish cross that supports the current movement, although the most common pattern from this structure is mainly the consolidation of current levels.
The DMI on the 4-hour chart shows bulls dominating the market but without great signs of strength. The bears tried to overcome the ADX linen over the weekend but have been rejected downwards.
Do you want to know more about my technical setup?
BTC/USD 240 Minute Chart
The BTC/USD pair is currently trading at $4,124 after consolidating the $4,050 support level conquered last Thursday. Moving averages remain perfectly aligned to the upside, reinforcing the current bullish movement.
Above the current price, the first resistance level for the BTC/USD pair is at the price level of $4,200 (price congestion resistance), then the second resistance level is at $4,400 (price congestion resistance), and the third resistance level is at $4,600 (price congestion resistance).
Below the current price, the BTC/USD pair has a stable support zone that extends to $3,900 and where congestion supports converge at $4,050, $4,000, $3,950 and $3,900 with the main moving averages at $4,030 (EMA50), then the SMA100 at $3,990 and finally at the $3,910 SMA200 price level.
Below this great support opens a free zone that would make it easy for the BTC/USD pair to reach the second support level at $3,700 (price congestion support). The third level of support is at $3,600 (price congestion support).
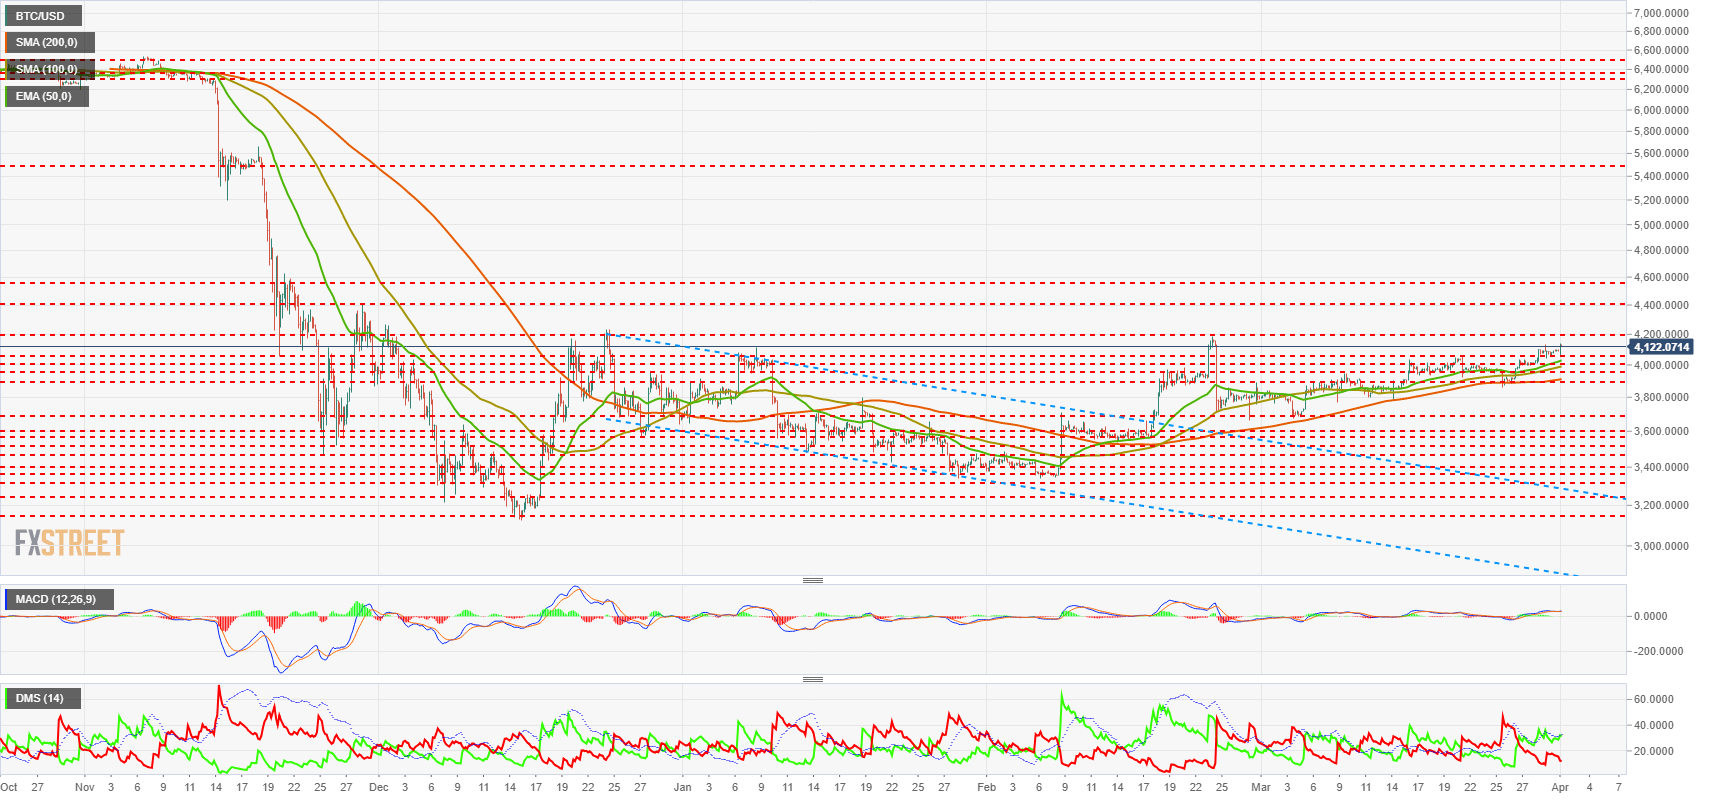
The MACD on the 4-hour chart shows how after two days that the lines had overlapped and lost all inclination but within the bullish side of the price. Today they are back to open slightly higher and support the continuation of the bullish trend.
The DMI on the 4-hour chart both sides of the market remain below the ADX line, which implies a layer of general weakness for both sides of the market. This type of structure facilitates the appearance of violent and unexpected movements.
ETH/USD 240 Minute Chart
The ETH/USD is currently trading at the $143 price level after consolidating the $142.5 support level (price congestion support).
Above the current price, the first resistance level is at $151 (price congestion resistance), then the second resistance level is at $162 (price congestion resistance). The third resistance level for the ETH/USD pair is far away at the $180 price level (price congestion resistance).
Below the current price, the first support level for the ETH/USD pair is also a confluence zone although not as robust as in the case of Bitcoin. Below the price congestion support of $142.5 (price congestion support), the EMA50 at $140, the SMA100 at $138.7 and finally the SMA200 at $136.8. The second level of support is at $130.5 (price congestion support) while the third level of support is at $120 (price congestion support).
-636897067392957917.png)
The MACD on the 4-hour chart is a similar profile to the Bitcoin, although in the case of Ethereum with hardly any bullish reaction. It continues with a very flat pattern.
The DMI on the 4-hour chart shows a dangerous structure. The bulls have been losing strength with the same intensity with which the bears have gained it. They are already at the same level as each other, so the scenario for the next few hours is quite uncertain.
XRP/USD 240 Minute Chart
The XRP/USD pair is currently trading at $0.313, holding above moving averages but not breaking through the first resistance zone at $0.3175. Moving averages provide essential support.
Above the current price the first resistance level is $0.3175 (price congestion resistance), then the second resistance level is $0.328 (price congestion resistance), and the third resistance level is $0.335 (price congestion resistance).
Below the current price, the first support level is formed by the confluence of the leading moving averages, the SMA200 at $0.313, the SMA100 at $0.312 and the EMA50 at $0.310. The second support level for XRP/USD is $0.308 (price congestion support), while the third support level is $0.300 (price congestion support).
-636897068396699792.png)
The MACD on the 4-hour chart shows a slightly bullish profile with hardly any line spacing. It is a sideways bullish structure although quite fragile.
The DMI on the 4-hour chart shows how bulls manage to maintain control of the market and stay above the ADX line. On the other hand, the bears lose intensity and do not seem to have the intention of disputing the current hegemony of the bullish side.
Get 24/7 Crypto updates in our social media channels: Give us a follow at @FXSCrypto and our FXStreet Crypto Trading Telegram channel
Author

Tomas Salles
FXStreet
Tomàs Sallés was born in Barcelona in 1972, he is a certified technical analyst after having completing specialized courses in Spain and Switzerland. He expanded his technical training following the guidance of great experts on the financial markets.


